- NQ has experienced a significant rally of 47% since October, indicating strong bullish momentum with no signs of slowing down.
- Technical analysis reveals low-volume nodes and the presence of upward-pointing moving averages, indicating a potential acceleration in price movement.
- The relative strength index (RSI) confirms the bullish trend, reaching overbought levels, further supporting the positive outlook for NQ.
Bullish momentum
NQ has rallied 47% since the low made in October of last year, and the bullish momentum shows no signs of slowing down. I see no bearish case for Nasdaq at this point. Let’s take a look at the technicals and if we see NQ reaching all-time highs in the next few weeks or months.
Technicals
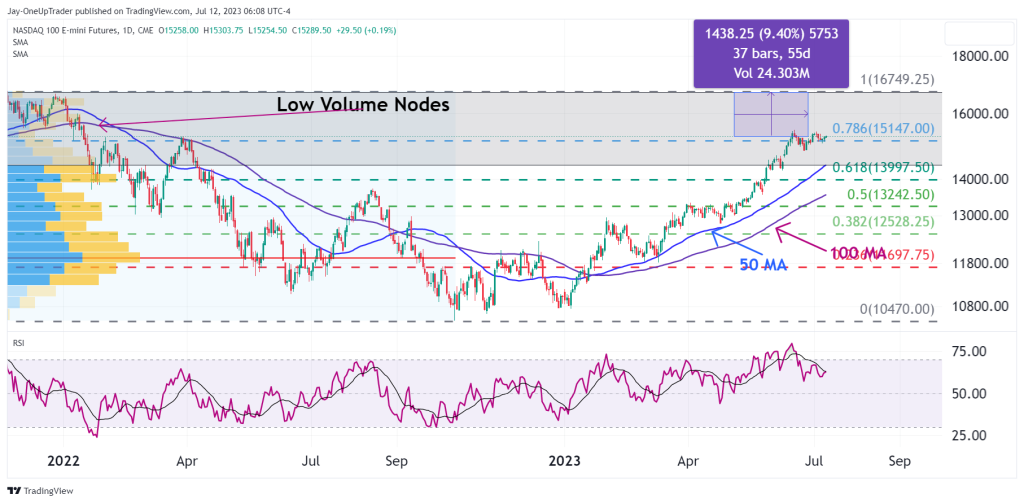
Low-volume nodes: There is a low-volume node between 15,150 and an all-time high of 16,749. Price generally moves quicker through low-volume nodes because of the lack of liquidity. NQ is currently trading at 15,300.
Moving Averages: The 50 and 100 moving averages are both pointing upward. The 50 is above the 100 and is sloping with strong bullish momentum.
RSI: The relative strength index continues to break into the overbought levels. In the case of a strong bullish trend as we see in NQ, when the RSI touches overbought, it is a bullish sign. This is an example of how we can use the RSI to confirm a trend.
Summary
The bulls are in full control of the Nasdaq futures. Technicals show now signs of a bearish reversal, and it would be ideal to look only for long setups on a shorter time frame. RSI, moving averages, and low-volume nodes all contribute to the bullish momentum.