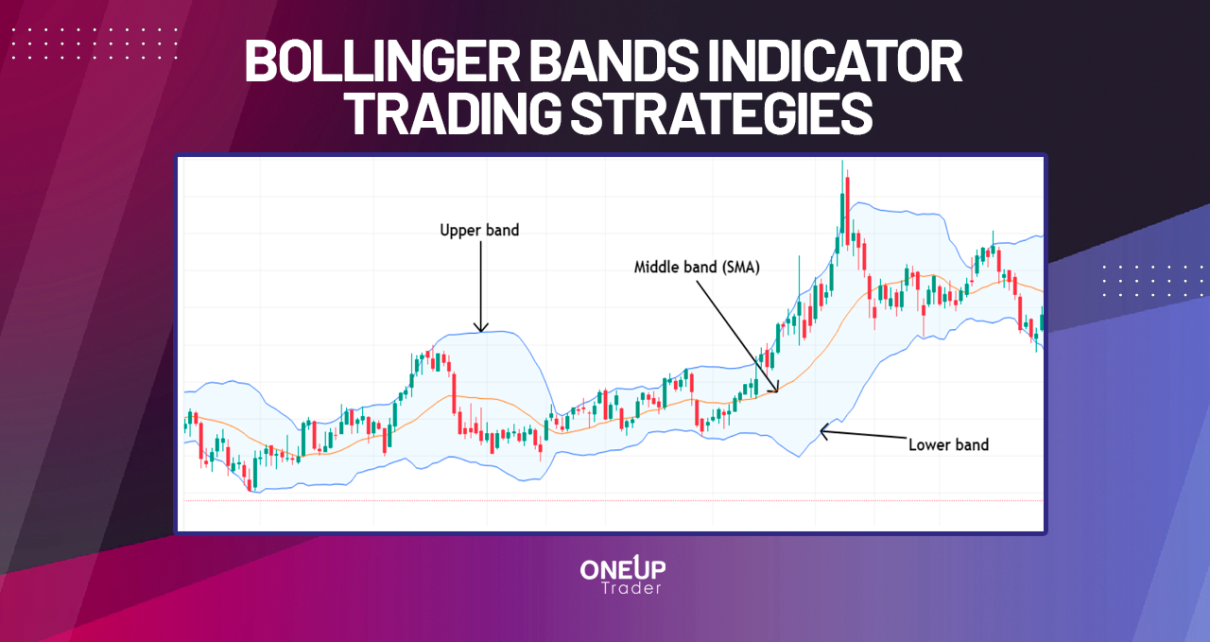
Despite their various advantages, nearly every technical indicator is faulted for lagging. Price action trading eliminates the overreliance on technical indicators simply by using candlestick and chart patterns to identify optimal entries and exits. The basis for price action trading is pure market movement; in a sense, price action trading is the foundation of all Read More…
Trading Tips
Technical Outlook: EURO FX Futures (6E)
The daily trend is still bearish Price consolidating around the $1 level Range-bound trading opportunities on the 2-Hour Chart Introduction Because of the worse-than-expected CPI data and a strong Dollar, we can take advantage of many potentially good trades available in the markets currently. The fear of an economic crash in Europe is rising due Read More…
Ichimoku Cloud Indicator Trading Strategies
The Ichimoku cloud indicator, also called the Ichimoku Kinko Hyo, is arguably one of the most versatile technical indicators. At first glance, it may appear convoluted and probably hard to understand, especially due to the several components. However, its greatest advantage is that it combines backward and forward-moving averages to determine an asset’s trend, momentum, Read More…
Technical Outlook on Gold Futures (GC)
Major Support Zone Proving to be strong on the Daily chart Downtrend Channel on the 2-hourly chart Potential 1-2-3 Reversal pattern on Daily Chart What Has Happened? Since August 31, we expected some strong support around the $1,715.3 level; we have seen that play out now with bids coming in the past week as the Read More…
Technical Outlook on Euro FX Futures (6E)
Euro trading below $1 for the first time since 2002 Bearish sentiment remains Potential bounce possible in the shorter term Consolidation zone on the hourly chart Rewind 2 weeks Looking back at the analysis we did on the Euro on August 19th, our call for the break below $1 has been realized. With such a Read More…
Gold Futures (GC) Prices Approach Major Support
Test of a major support zone possible Short trade results from a retracement into the Gaussian channel RSI oversold on shorter time frames Daily Chart The daily outlook has been bearish for the past six months, with prices dropping 19.27% from the peak on March 8. The major support zone at $1,715.3 has been tested Read More…


