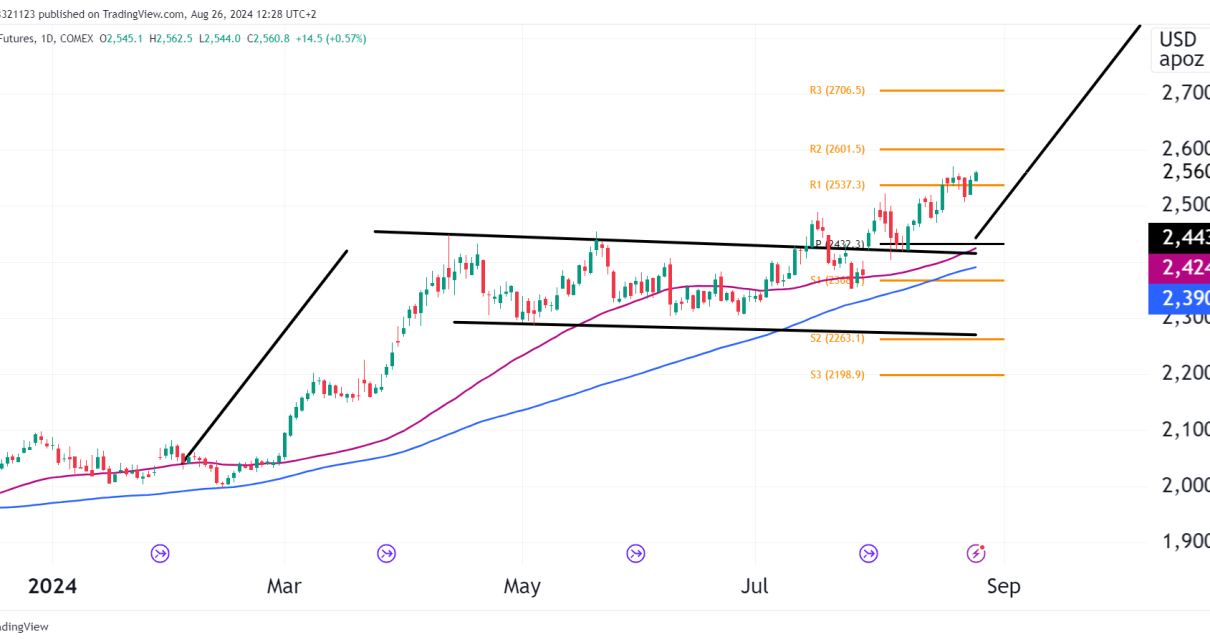
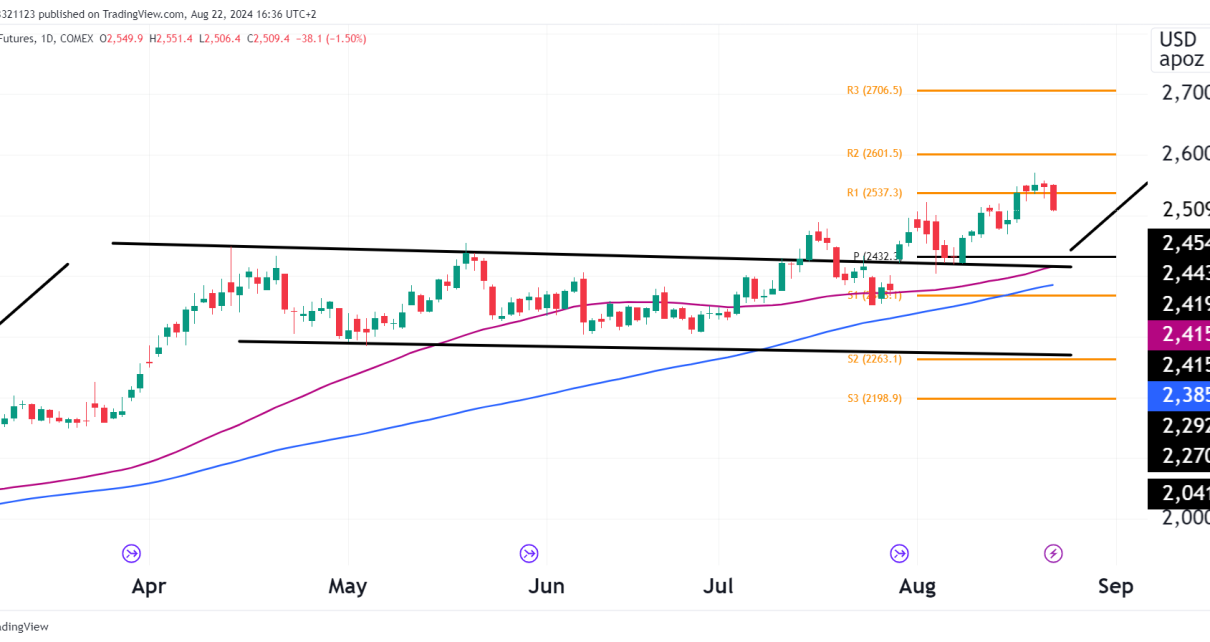
The chart provided displays the U.S. Dollar Index (DXY) on a weekly timeframe. Let’s analyze the technical indicators and identify potential bearish/short high-probability trade opportunities. Technical Analysis Descending Triangle Pattern: There is a symmetrical triangle formation. The price recently broke below the lower trendline of this triangle, signaling a potential continuation of the downtrend since Read More…
Technical Analysis
Australian Dollar Hits Resistance Level
Introduction The Aussy Dollar has been gaining grind like most other currencies as the US Dollar has been weakening. Key Technical Observations: Resistance Level: The price faces strong resistance around the 0.6812 level. This level has been tested multiple times and is holding, suggesting that the bulls are struggling to break through this barrier. Pivot Read More…
Bull & Bear Trades in S&P 500 Futures (ES)
Trend Analysis: The weekly chart for the S&P 500 (ES) futures has been surging alongside all other US equity markets since November of 2023. After a recent break below the trend line, the bulls stepped back in, and the price began its upward movement once more. We should not get euphoric though, there is a Read More…
Will Gold Breach ATH Again?
Introduction Gold futures have continued their steady run upwards, boasting an impressive 31% return over the past year. The question is whether we see this trend continuing. Technical Analysis The daily chart shows us the 50-moving average positioned well above the 100-moving average. There is also a flag formation where gold sat sideways since the Read More…
Crude Oil Futures (CL) Double Bottom In!
Introduction A few days ago, we looked at CL, which was approaching a significant support zone at $72 per barrel. Price continued to fall and hit the support zone and bounced out with strength as bullish buy pressure surged. The daily chart now has a double bottom and a bullish candlestick pattern printed on it that Read More…
Gold Dumps as CPI Increases, Technical Analysis Still Bullish
Recent News US Economic Data: The release of the US Consumer Price Index (CPI) data on August 14 showed a slight increase, which led to fading expectations of an imminent rate cut by the Federal Reserve. This resulted in a minor decline in gold prices, as the likelihood of a rate cut, which would weaken Read More…


