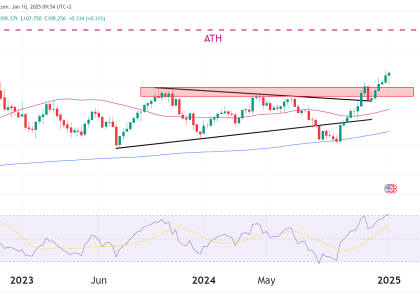
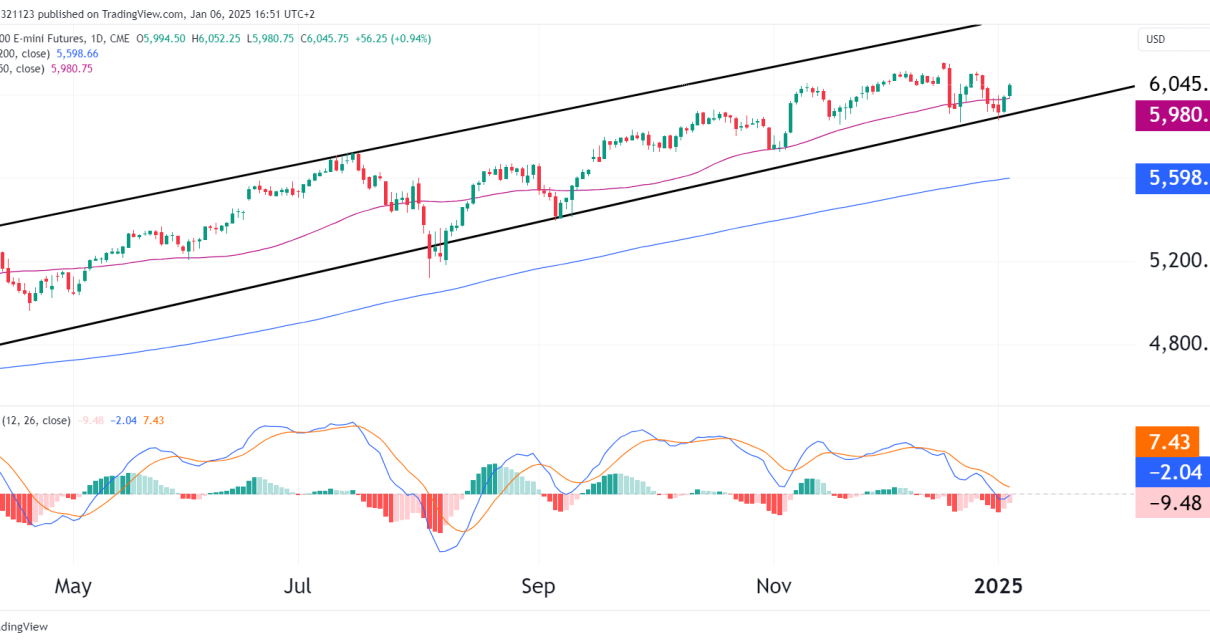
Technical Analysis

S&P 500 E-mini Futures (CME, Weekly Chart) Technical Analysis

Current Overview and Market Sentiment:The S&P 500 futures chart is showing signs of exhaustion after an impressive rally over the past two years. As we approach September 2024, the market is showing clear indications of bearish divergence, warning us of a possible trend reversal or significant correction in the coming weeks. Price Action: The S&P Read More…

futures trading strategies for beginners
Technical Analysis

Bitcoin Futures Technical Analysis (CME, Daily Chart)

Technical Analysis: Descending Channel: The primary structure in play is a descending channel, which has kept price action constrained between roughly $75,000 and $50,815. Until Bitcoin can decisively break out of this channel, the prevailing trend remains slightly bearish in the medium term but still bullish in th belong term. Potential Support Levels: Short-Term Outlook: Read More…

Technical Analysis

E-mini Russell 2000 at pivotal technical level: bearish or bullish?

Introduction The E-Mini Russell 2000 Index Futures, often seen as a bellwether for small-cap stocks in the U.S. market, is currently positioned at a point where it could swing bullish or bullish with volatility. As all markets around the world continue to surge at a time when political and economic unease is high, technical analysis Read More…

Technical Analysis

NASDAQ futures (NQ) under pressure, 100-day moving average in focus

Technical Analysis Moving Averages: Recent Price Action: The price has recently faced resistance near the 50-day moving average as bulls tried to push prices higher and has pulled back slightly. This rejection from the 50-day moving average shows selling pressure at these levels. Market Sentiment: The overall trend before the recent pullback in July was Read More…

Technical Analysis

Bearish momentum in DXY, short trade opportunity – watch 102 resistance

The chart provided displays the U.S. Dollar Index (DXY) on a weekly timeframe. Let’s analyze the technical indicators and identify potential bearish/short high-probability trade opportunities. Technical Analysis Descending Triangle Pattern: There is a symmetrical triangle formation. The price recently broke below the lower trendline of this triangle, signaling a potential continuation of the downtrend since Read More…