- Resistance level at the recent all-time high.
- Support levels are confirmed by moving averages and volume activity.
- Examination of technical indicators for trend strength and potential reversals.
Introduction
Today, we take a technical view of the NASDAQ 100 E-mini Futures (NQ) using both weekly and daily charts to identify critical price levels and trends. Equities are targeting all-time highs, and NQ is no different. Let’s see what the charts tell us and if we see all-time highs being hit by year’s end.
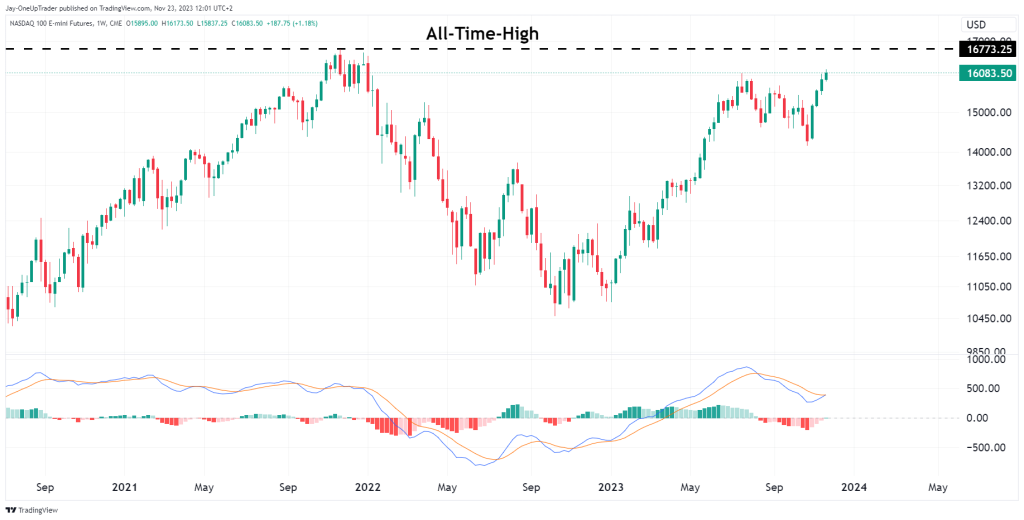
Weekly Chart Analysis: Understanding Long-Term Trend Dynamics
The weekly chart shows that prices are approaching an all-time high, continuing with the strong bullish trend. This level is the immediate resistance and a key point to determine future price direction. A breakthrough would suggest continued bullishness, while repeated rejections could indicate a possible reversal.
The MACD on the weekly chart is narrowing, which suggests a loss of momentum or a trend change. Traders should watch for a crossover as a signal for potential moves.
Daily Chart Analysis: Short-Term Price Action and Key Levels
On the daily chart, prices are testing a critical resistance level. A consistent hold above this level could confirm the continuation of the uptrend. The 50-day and 100-day moving averages provide support levels that could influence bullish sentiment. A sustained break below these moving averages might signal a trend reversal.
Volume profile on the daily chart indicates substantial trading activity at these prices, which reinforces their significance as support or resistance zones. As you can see in the chart below, price has already cleared above the high-volume nodes, which were between $13,900 and $16,000. Above this level, we move into low-volume territory which is also low liquidity, so price can move much quicker in both directions.
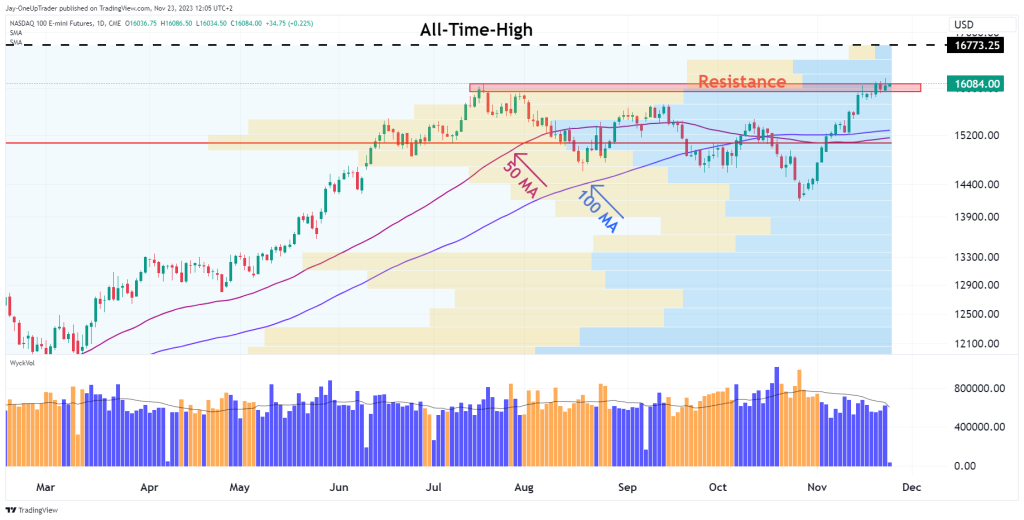
The resistance should be clear at the all-time high and support should be found at the moving averages as they are currently converging.
Conclusion
The analysis of NASDAQ 100 E-mini Futures reveals significant levels to monitor: the all-time high as resistance and the daily moving averages as support. Traders should apply this technical insight with disciplined risk management to navigate the futures market effectively. The upcoming price action at these levels will be critical for confirming the market’s direction in the short to medium term.