- Key Price Levels in Focus: Get the latest on Crude Oil Futures with a look at important prices like $74.91, $95.03, and $68.07.
- Easy-to-Follow Chart Analysis: Understand what the current trends in CL futures mean for your trades, explained in a clear, straightforward way.
- Practical Trading Tips: Find out what these market changes could mean for you
Key Price Levels to Watch:
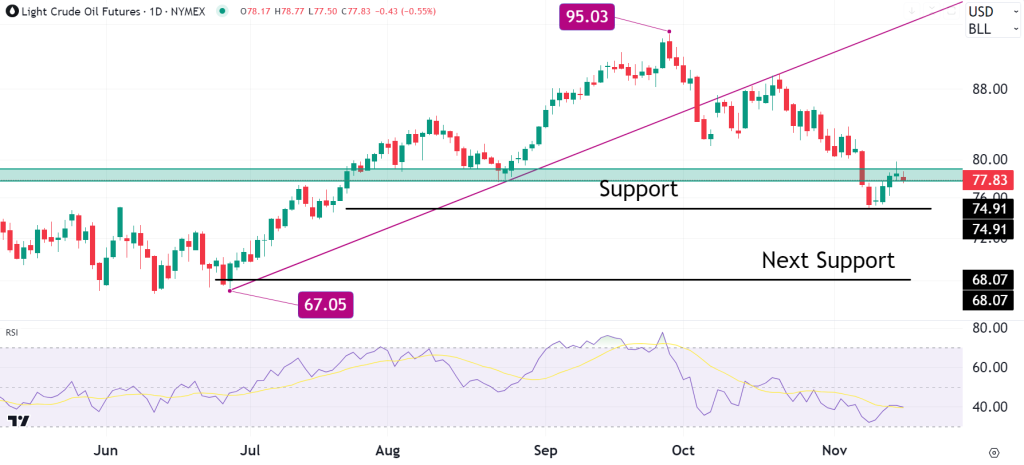
- Recent Low and Potential Support at $74.91: CL futures are showing a critical juncture around $74.91. If prices manage to stay above this level, it could be seen as a sign of strength.
- October High of $95.03 as Resistance: The high point in October at $95.03 is another key level. If prices approach this level again, it could indicate a renewed bullish sentiment.
- Major Support Zone at $68.07: The $68.07 mark is a significant area to watch. If prices drop to this zone, it might signal a stronger bearish trend.
Technical Indicators Overview:
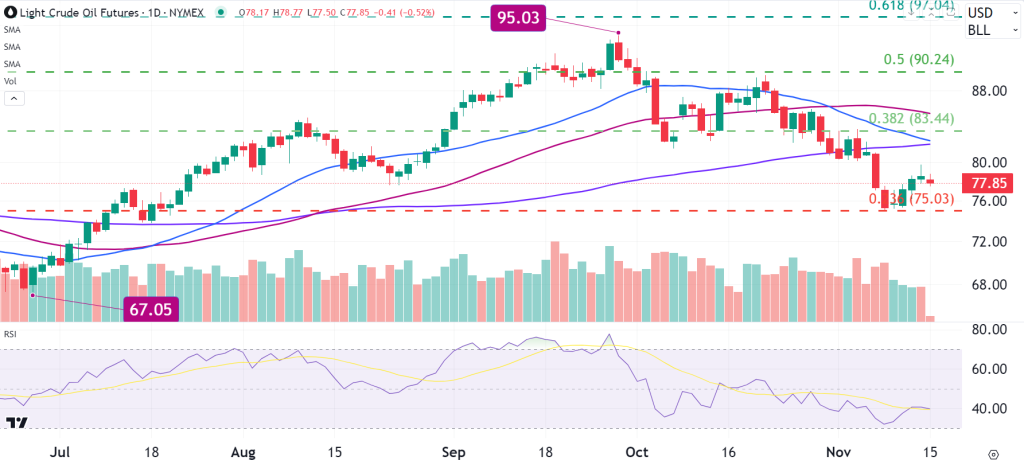
- Moving Averages: The relationship of CL futures with their moving averages is showing a mixed market mood. How prices move around these averages in the coming days could give us more clues.
- RSI (Relative Strength Index): The RSI is currently in a neutral zone. A move above 70 might signal that the market is becoming overbought, while dropping below 30 could indicate overselling.
- Volume Trends: The trading volume at key price levels, especially around $74.91 and $95.03, will be important. Strong volume at these points could reinforce their roles as support or resistance.
Fibonacci Retracements:
- Trading Between $74.91 and $95.03: Looking at the range from $74.91 to $95.03, the Fibonacci retracement levels can highlight important areas. The midpoint of this range could be particularly telling. If prices stay above or below this middle point, it could show which way the market is leaning.
Potential Market Scenarios:
- Bullish Outlook: If the price consistently stays above $74.91, especially with strong volume, it could suggest a move back toward the $95.03 level. This would be a positive sign for bulls.
- Bearish Outlook: On the other hand, if prices break below $74.91 and head towards $68.07, especially with increasing volume, it could suggest a bearish trend is taking hold.
Conclusion
As we wrap up our technical analysis of Crude Oil Futures, it’s clear that the market is at a crossroads, with key levels at $74.91, $95.03, and $68.07, offering guidance on potential future movements.
Remember, the true skill in futures trading lies not just in reading the charts and indicators but in applying robust risk management strategies. Markets can be unpredictable, and even the most thorough analysis comes with its uncertainties. As you align your trades with these technical insights, always prioritize protecting your capital. Stay disciplined, keep an eye on the evolving market dynamics, and adjust your strategies accordingly. The path to success in trading, especially in a market as dynamic as Crude Oil Futures, is paved with patience, discipline, and an unwavering commitment to sound risk management.
Let’s approach the market with a clear mind and a focused strategy, ready to capitalize on the opportunities that lie ahead while safeguarding our investments against potential volatility. Happy trading!