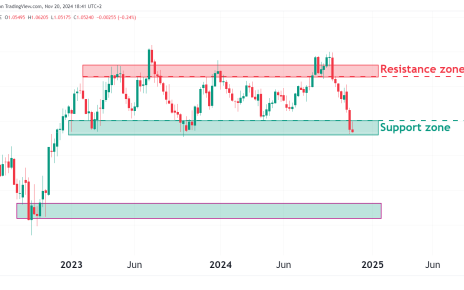
- Key resistance and support levels in the weekly and daily charts.
- Trend analysis on the E-mini Dow Jones (YM) Futures.
- Actionable insights for traders.
Introduction
The E-mini Dow Jones (YM) Futures have been exhibiting a consolidation and breakout pattern, as observed in the weekly and daily charts. We must closely monitor these fluctuations to gauge the market’s course as we approach the end of the year. Do you think we will reach all-time highs in equities before year’s end? Let’s see.
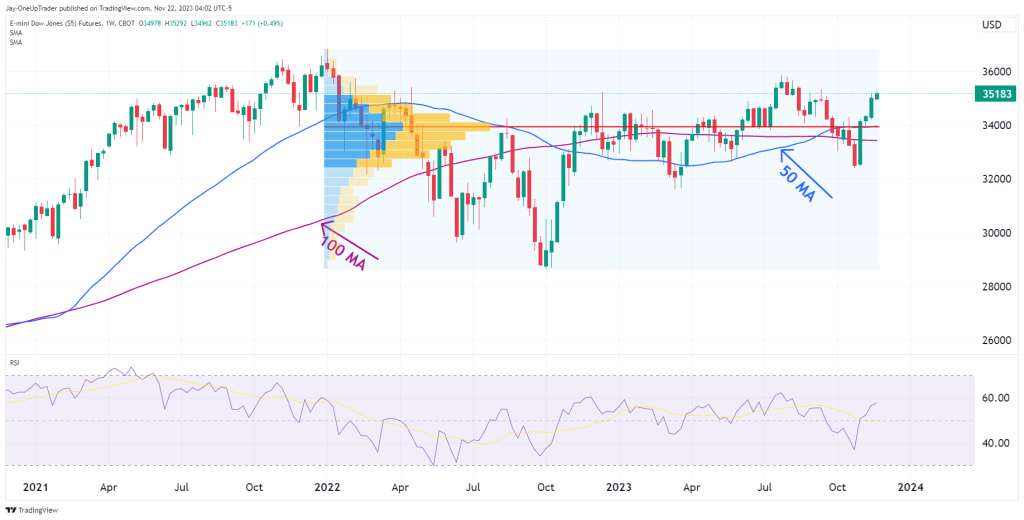
Weekly Chart Analysis
On the weekly timeframe, the YM Futures show a challenging resistance near the 35,000 mark. Historical reactions give this psychological round number importance, making it a short-term barrier for the bulls. The 100-day moving average (100 DMA) is curving upward, indicating long-term bullish momentum. The fact that YM has also pushed through the thick layers of volume between 33,000 and 35,000 also means it has a lot of support behind it, as that is where most of the volume is.
The Relative Strength Index (RSI) on the weekly chart is hovering just below the overbought territory. While the current level does not indicate an immediate reversal, it suggests that the upward momentum may be reaching its climax for the time being.
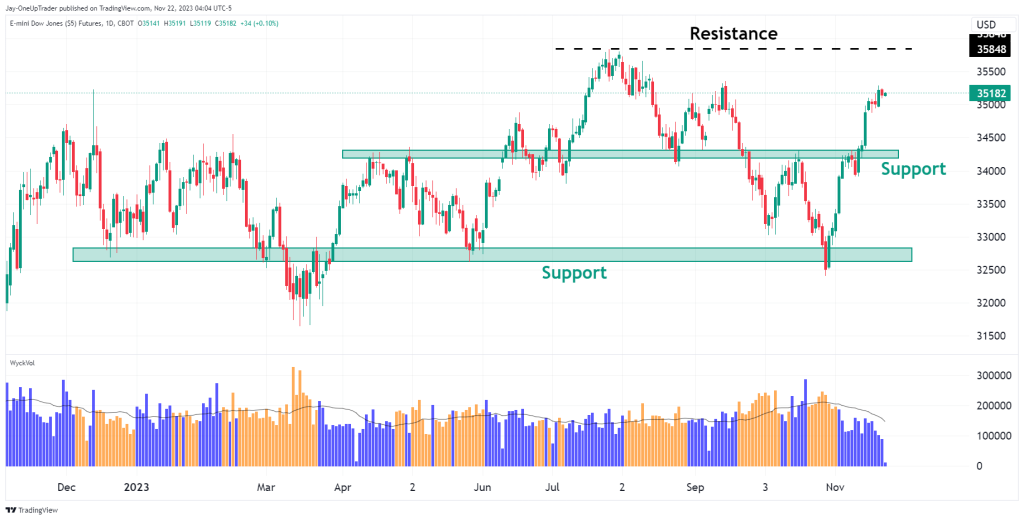
Daily Chart Analysis
Transitioning to the daily chart, the YM Futures have recently bounced off a support zone around the 34,000 level. This support is underscored by multiple price touches in the past, marking it as a key level for maintaining the current uptrend. There is a resistance line at 35,848 which bulls can target and then hope for a break above.
The volume profile visible range (VPVR) indicates a lower trading activity below the current price level, potentially offering less resistance to downward movement if the price were to reverse.
Trade Setup Considerations
For bullish traders, a sustained break above the 35,000 resistance could pave the way for higher targets, with the next psychological level at 36,000 in sight. On the flip side, a failure to overcome current resistance and a subsequent fall below the 50 SMA could signal a short-term bearish outlook, with the 34,000 support level becoming a crucial level.