- Analyzing the price action as the market finds support at a key level.
- The rsi tells us that bullish sentiment is stronger at the moment.
- Potential trade setup for bulls and what we must watch out for.
Technical analysis
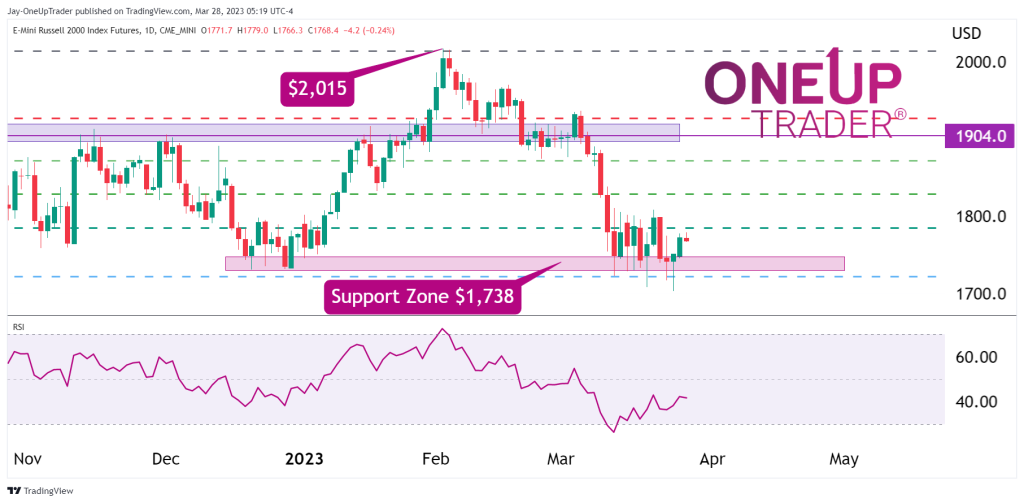
Price action: There is a strong band of support that has formed at the $1,738 level, which was our previous bearish target. It is all the 0.78 Fibonacci level. The candlesticks show strong bullish sentiment as every time price dips below $1,738, it gets bid back up. This can be seen by the multiple wicks to the downside.
RSI: The RSI is also showing bullish price action as the market sits sideways at current levels, but the RSI continues to print higher highs. This is a sign that bears are losing control, and the bulls are beginning to overpower them. From here, there is a potential long trade, but we must keep in mind that anything is possible, and we can only think in probabilities. There is no certainty in any trade or investment.
The trade
The trade is a simple one and hinges on the fact that price will remain above the current support structure that has formed. We have defined stops just below, which is around the $1,700 level, and possible targets of $1,904. Of course, we need to see price remain above the support for the bullish sentiment to remain. If we don’t see a rally of some sort within the next few days, it tells us that the bears are still strong and price could drop further. This will liquidate long positions from here, fueling the drop. Bulls must keep this in mind and remain objective.