

The S&P 500 E-mini Futures (ES) continues to trend upwards within a well-defined ascending channel. The bullish trend remains intact due to a combination of technical and positive market sentiment across equity markets globally. As equities continue their rally, dips are presenting high-probability buying opportunities for traders looking to ride the trend higher. Let’s take a deeper look into the technicals.
Technical Analysis
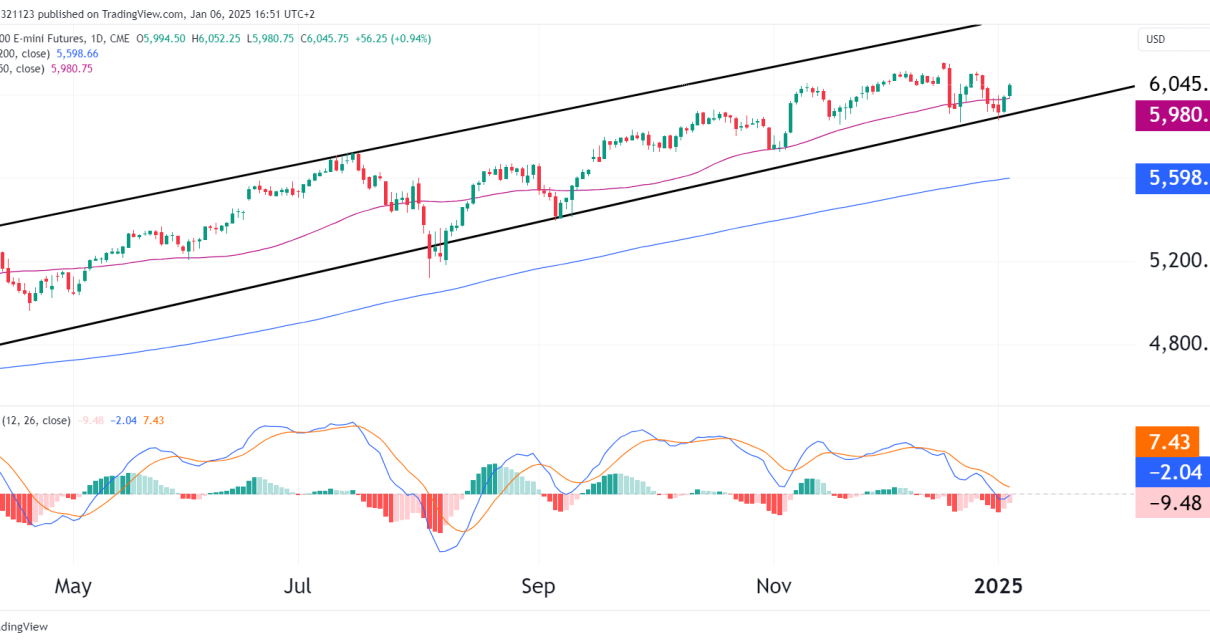
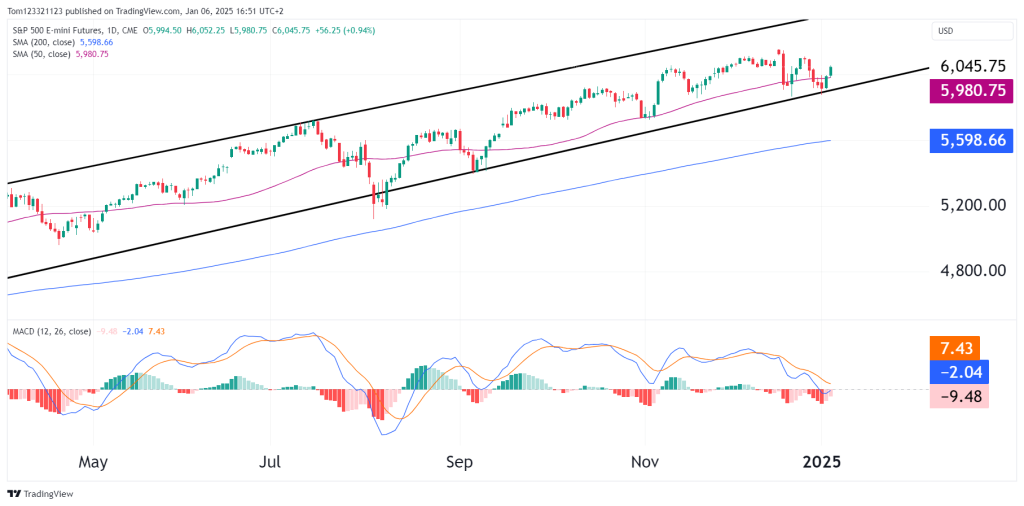
Ascending Channel Formation
- The price is moving within a clearly defined ascending channel. (BULLISH)
- The current price action is rebounding from the lower boundary of the channel. (BULLISH)
Support from the 50-Day SMA
- The 50-day SMA (5,980) is acting as dynamic support, reinforcing the bullish momentum as the price holds above it. (BULLISH)
- Additionally, the 200-day SMA (5,598) remains in a strong uptrend. (BULLISH)
MACD Turning Bullish
- The MACD histogram is transitioning from negative to positive territory, while the signal line is beginning to cross upward. This shift signals that bullish momentum is returning after the brief consolidation phase.
Bullish Case: Rally Continuation Toward New Highs
- Key Levels to Watch:
- Immediate resistance at the upper channel boundary, currently near 6,150-6,200.
- A break above this level could trigger further momentum, with 6,300 as the next major target.
- Trend Support:
- The lower boundary of the channel and the 50-day SMA (5,980) provide strong support zones. Any pullbacks toward these levels would likely attract fresh buying interest.
Bearish Risks: Temporary Pullbacks
- Support Zones:
- In the event of a short-term pullback, the 5,980 level (50-day SMA) and the lower channel boundary would need to hold to maintain the bullish trend.
- A break below these levels could see the price retest the 5,800 zone or 200 SMA for further support.
Trade Ideas
Long Setup – Buy the Dip
- Entry: Near the 5,980 level (50-day SMA).
- Target 1: 6,150 (upper channel boundary).
- Target 2: 6,300 (psychological level).
- Stop Loss: Below 5,920.
Outlook & Summary
- Short-term (1-2 weeks): The rally is likely to continue within the ascending channel, targeting the 6,150-6,200 zone. Any dips toward the 50-day SMA (5,980) are opportunities to add long positions.
- Medium-term (1-3 months): A breakout above the upper channel boundary could extend the rally to 6,300 or higher, aligning with the broader equity market rally.
- Long-term (3+ months): As long as prices remain above the 200-day SMA (5,598), the bullish trend remains intact.
