

Introduction
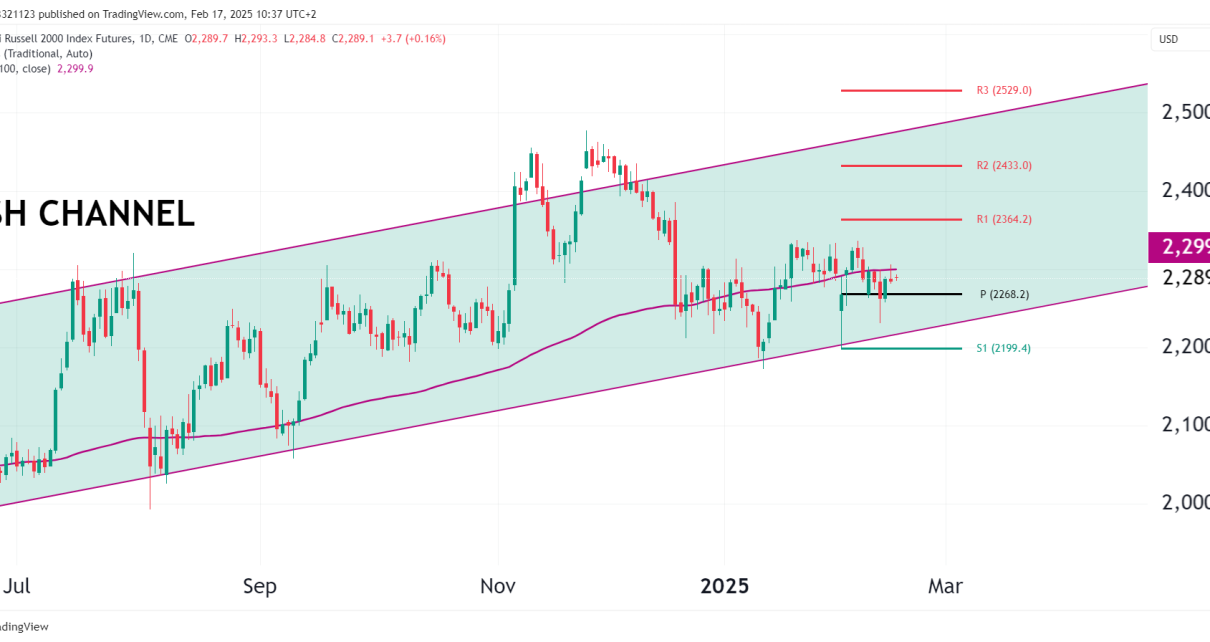
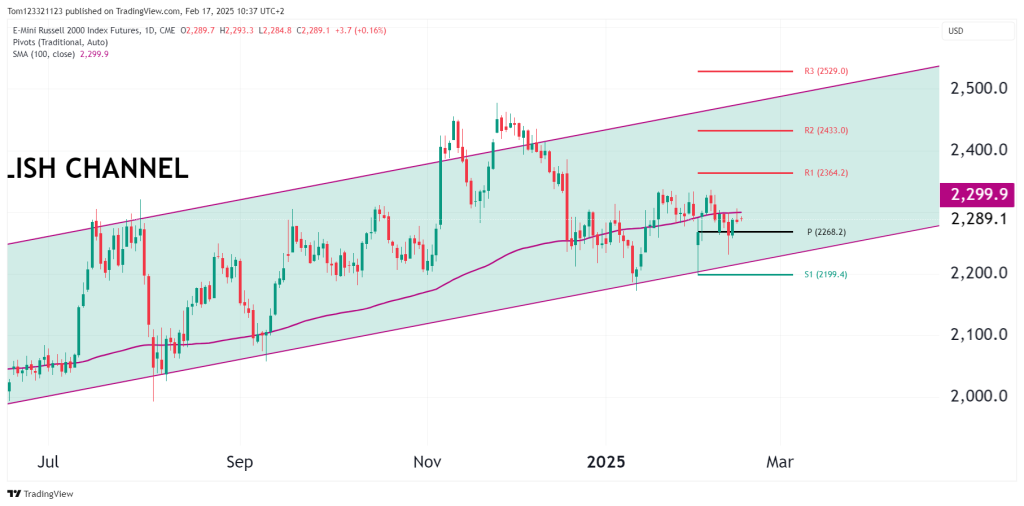
The Russell 2000 E-mini futures (RTY) are inside a bullish rising channel, despite recent choppy price action. Small-cap stocks have struggled for direction, but the 100-day SMA (2,299.9) trending upward steadily.
As of today, RTY is trading at 2,289.2, up +0.17%, hovering near key pivot levels. Bulls are looking for a decisive move higher, while bears aim to push price below support at 2,268.2 to test lower levels.
Market Drivers & Key News Events
Several factors are impacting small-cap stocks and the Russell 2000 index:
- Interest Rate Expectations: The Federal Reserve’s next move remains uncertain, as inflation data has come in slightly higher than expected. Higher rates tend to weigh more heavily on small-cap companies due to higher borrowing costs.
- Earnings Season Impact: Many smaller companies are reporting mixed earnings, with some sectors showing resilience while others remain under pressure.
- Market Sentiment & Risk Appetite: The Russell 2000 tends to outperform in risk-on environments, and if broader equity markets remain bullish, small caps could follow.
Technical Outlook
Bullish Channel Still Intact
- Price remains inside a rising channel, with higher highs and higher lows supporting long-term bullish structure.
- The pivot point (2,268.2) is acting as a key short-term support zone which bulls must keep the price above.
Key Support & Resistance Levels
- Resistance Levels:
- 2,299.9 (100-day SMA – Short-term hurdle)
- 2,364.2 (R1 – First breakout target)
- 2,433.0 (R2 – Extended target if momentum builds)
- Support Levels:
- 2,268.2 (Pivot – Key support zone)
- 2,199.4 (S1 – Critical downside level & channel support)
- 2,100.0 (Bearish breakdown target if selling intensifies)
A clear break above 2,299.9 could trigger a move toward 2,364.2, while failure to hold 2,268.2 could push price back toward the lower channel boundary at 2,199.4.
Momentum & Market Sentiment
- 100-Day SMA: Price needs to clear this for further upside.
- Pivot Levels Confirm Consolidation: Price is near the middle of the range, suggesting indecision.
- Risk Sentiment Still Uncertain: Small caps need a broader market push to sustain upside momentum.
Bull & Bear Scenarios
Bull Case: Breakout Above 2,300+
- A move above 2,299.9 (100-day SMA) could trigger upside momentum, targeting 2,364.2 (R1 Pivot) but there is small resistance at 2327 that needs to be cleared first.
- Improved risk sentiment and Fed rate cut expectations could fuel small-cap strength.
Bear Case: Breakdown Below 2,268.2
- If price fails to hold the pivot, a move toward 2,199.4 (S1 Pivot & channel support) is possible.
- A break below 2,199.4 would shift structure bearish, opening the door for 2,100.0.
Final Outlook
- Short-Term (1-2 Weeks): Neutral to bullish, watching for a break above 2,299.9.
- Medium-Term (1-3 Months): Bullish as long as price stays in the channel and above 2,199.4.
- Long-Term (6+ Months): Bullish, but only if small caps outperform broader markets.
