

Introduction
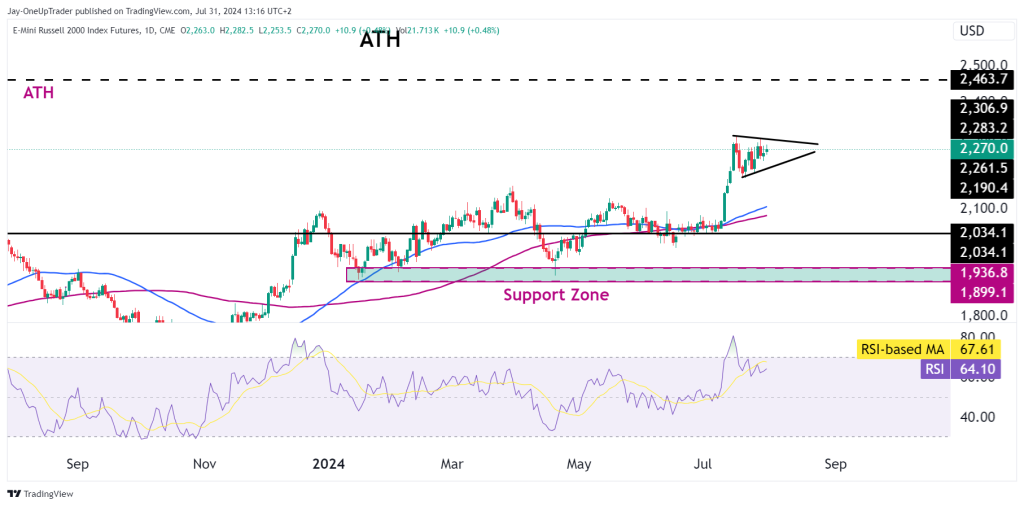
We looked at the break out in RTY two weeks back, and now, the daily chart is forming a pennant chart pattern. The penant formation is a high probability chart pattern that can lead to a big swift move initially which is why we think we could see RTY break its ATH next week or the week after that.
The main aspect to watch for is that price does not break below the low of the penant ($2,190). We should see price bounce off the support of the penant too.
Bullish Trade Setup
Penant Breakout:
- Entry: Look for a breakout above the upper trendline of the penant.
- Target: The first target would be the all-time high (ATH) at 2,463.7.
- Stop Loss: Place a stop loss just below the lower trendline of the triangle to manage risk.
Traders can also look to buy the dips on smaller time frames ensuring the correct placement of the stop loss so the trade doesnt get ‘chocked’.
If you have any technical analysis or a great trade you took with an explanation of your process, please send it to us via our Instagram here or email [email protected] or [email protected]. The trader who sends the best analysis/trade that week will receive a 25% discount code to use on any Evaluation.