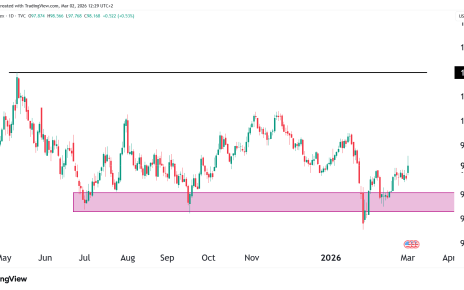
Dow Jones Futures (YM) have slightly underperformed by about 5% vs. ES and NQ, but nevertheless, the trend is bullish. The key feature on the daily chart is the ascending triangle formation, which gives us a target at the 200% FIbo level. This is the bullish target for the medium term.
Keep an eye out for this weeks inflation numbers, they will be crucial for short and medium term price action.
Let’s look at key levels, technical analysis of the indicators, and trade opportunities.

Key Levels:
- Support Levels:
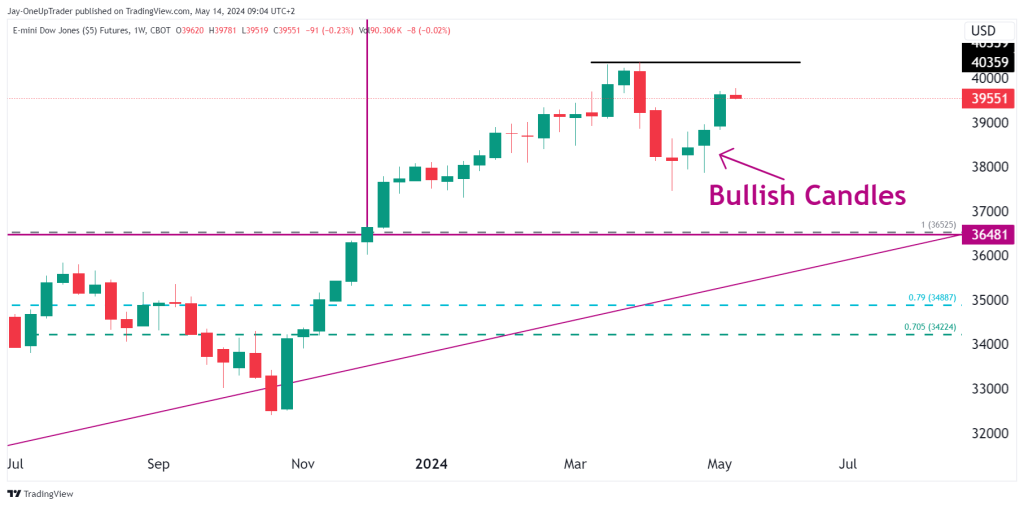
- 36481: Close to the 0.79 Fibonacci retracement level and the previous all-time high, as well as the horizontal resistance of the ascending triangle.
- Resistance Levels:
- 41363: The 1.62 Fibonacci extension level, a target for further up moves.
- 44328: The 200 Fibonacci extension level, the big bull target for the medium term.
Long Trade Opportunities:
- Pullback to Support:
- Entry: Look for a pullback to the support zone around 36481 but it might not happen with the current trend.
- Target: First target at 39564, then 41363 (1.62 Fibonacci extension level), and potentially 44328 (2 Fibonacci extension level) for a more extended move.
Monitoring and Adjustments:
- Trend Continuation (long term): Continuously monitor the trendline from the 2020 low. If the trendline holds, it can provide additional confidence in long positions.
- Economic Events: Stay aware of major economic events and news that could impact market sentiment and volatility in particular, inflation reports.