


- Long trade success: Demonstrates the profitability of the trade based on objective candlestick pattern analysis.
- First profit target: Approaching the target price of $75.72, potentially indicating further upward movement.
- Technical indicators: RSI crossing above 50, 100-day MA acting as a price magnet at $76, and recent strong candlestick patterns suggesting bullish strength.
The trade
Before we get into the new price action and the profitable trade regarding CL, take a look at the previous article to see how we entered the trade in the first place.
The long has been successful so far, and it shows just how powerful it can be if we understand candlestick patterns objectively. The giant spinning top, after a strong downtrend, gave us everything we needed to enter into the long position. After almost two weeks of relatively sideways action, we finally see the trade paying off. This also points out how important it is to be patient in financial markets.
As price approaches the first profit target, let’s see if there is anything we can adjust moving forward.
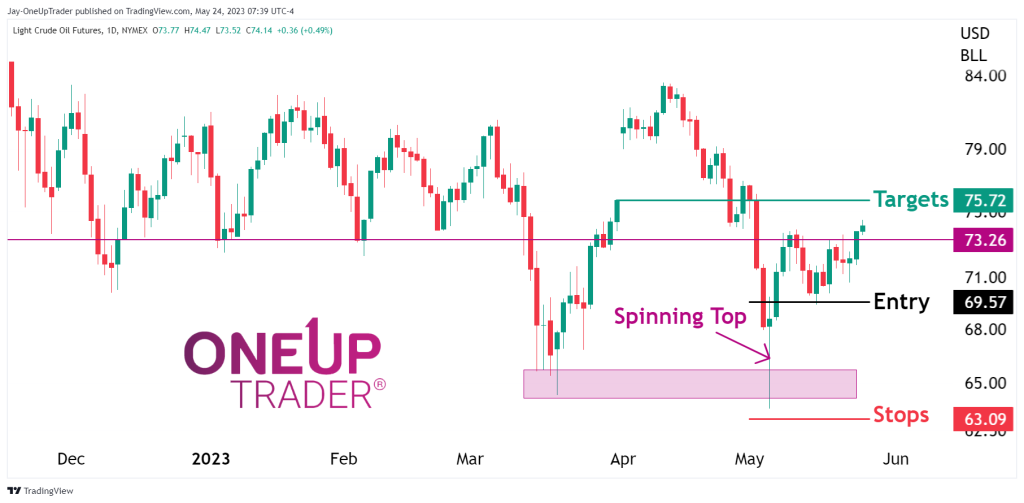
For the moment, Oil bulls seem adamant about moving higher. The first target is $75,72. From here, price would have moved back into the consolidation zone between $73 and $82. It is too early to say if we can target the upper prices of this range, but we can monitor price action in the coming days.
Technicals
RSI: The relative strength index has crossed above the 50 line indicating bullish momentum is strong.
100-Day MA: The 100 daily moving average is trading at $76, currently acting as a magnet for price which is $74.20.
Candlesticks: Strong recent candlesticks like the big green candle from yesterday and the bullish wick the day prior indicate further bullish strength.

