

Technical Analysis
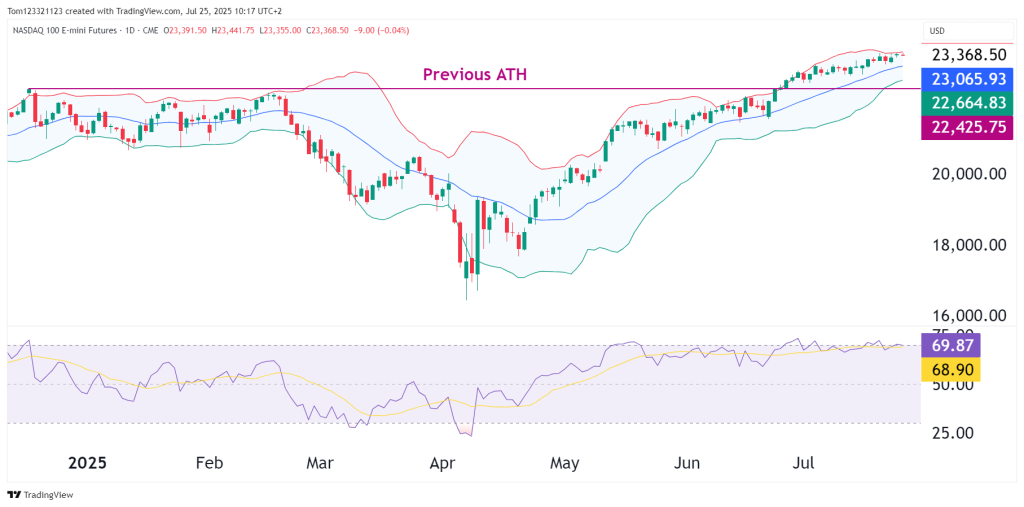
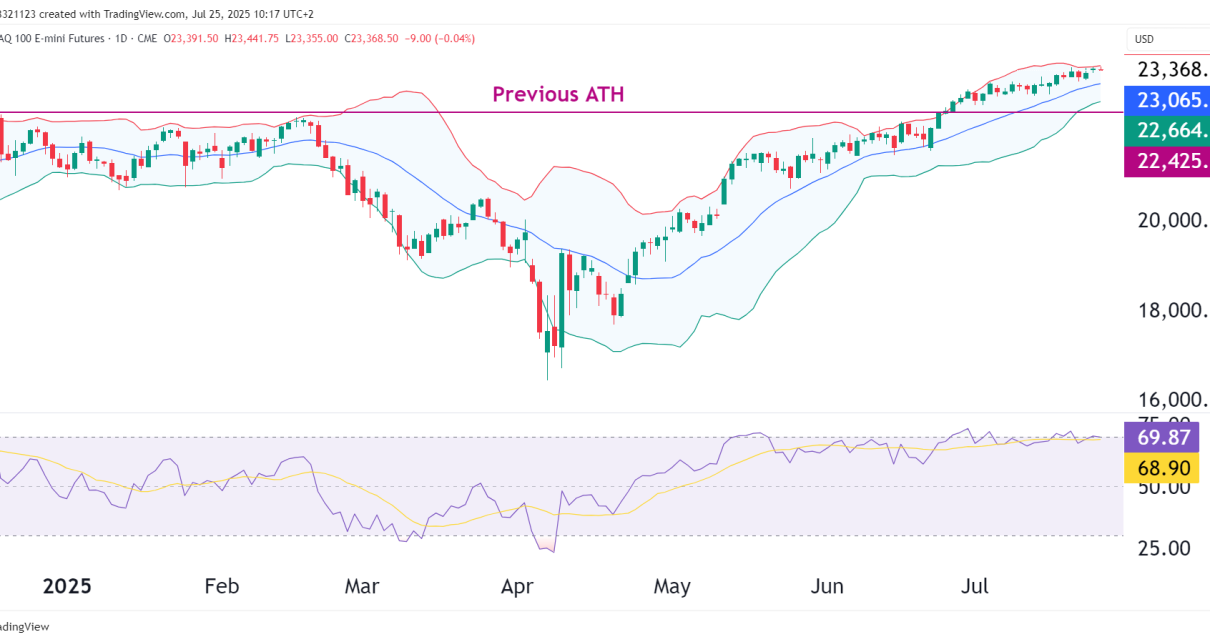
After a persistent multi-week rally, the NASDAQ 100 has continued its rally up 42% since the lows in April. The index recently broke above its previous all-time high (ATH), but the current candles show narrow bodies near the upper Bollinger Band, accompanied by a flattening RSI near overbought.
Chart Highlights:
- Upper Bollinger Band Contact: The price has hugged the upper band for days, and the narrow Bollinger bands tell us that the volatility is very low at the moment.
- RSI: At 69.87, it’s been in overbought territory for nearly three months; however, in slow grinding markets like these, the RSI can remain there for extremely long periods of time.
- Support Structure:
- First key level is the 22,425–22,665 band (previous ATH).
- Secondary support sits at 23,065.93, the 20-day average.
Macro & Global Context
Several global and domestic factors have helped fuel the recent rally but some have also turned into possible headwinds.
Supporting Events
- US earnings season (so far) has beaten expectations, especially in large-cap tech and AI sectors.
- Fed tone has remained balanced, with inflation trends easing modestly, reducing rate hike fears.
- The US Dollar is still weak.
Emerging Headwinds
- Geopolitical volatility is creeping back in:
- Renewed tensions between China and Taiwan after recent military drills.
- Ongoing Israel-Iran conflict causing risk repricing in energy and Middle East exposure.
- Yields are creeping higher again this week, with the 10-year Treasury approaching 4.5%, which may cap growth stock multiples.
NQ vs. Other U.S. Indices
| Index | Status vs ATH | Notes |
|---|---|---|
| NQ (NASDAQ 100) | Above ATH | Tech-led rally intact; overextended short term |
| ES (S&P 500) | Blue sky breakout | Broader participation, RSI now >72 |
| RTY (Russell 2000) | Still below ATH | Catch-up underway, value sectors lifting |
| YM (Dow Jones) | Testing highs | Industrials outperforming in July |
NQ remains the leader, but RSI divergence with RTY and stalling momentum mean sector rotation might be quietly underway, especially toward cyclical and value names.
Probabilities Table (Next 1–3 Weeks)
| Scenario | Estimated Probability | Rationale |
|---|---|---|
| Extension to 23,600–23,800 zone | 40% | Price still above support, macro calm, earnings support |
| Sideways in 23,000–23,400 range | 40% | Profit-taking, Bollinger compression, RSI flattening |
| Pullback to 22,600–22,400 (old ATH) | 20% | Global risk flare-ups or bond yield spike |
Trades Outlook
Short-Term (1–7 days):
Caution warranted. Market is showing signs of exhaustion. Momentum is intact, but conviction is waning. A pause here would be healthy. Avoid aggressive new longs unless new catalyst emerges.
Medium-Term (2–4 weeks):
Still bullish. As long as NQ holds above the old ATH (~22,425), the path of least resistance remains higher. Watch earnings from major remaining tech names and FOMC tone.
Long-Term (2–6 months):
Uptrend remains structurally intact. AI, cloud, and software themes continue to underpin strength unless macro deteriorates significantly.
Trade Setups to Consider
Trend Continuation:
- Buy dips near 23,100–23,200, stop below 22,900
- Target: 23,600–23,800
Short-term Reversal Play:
- Sell near 23,400–23,450 if price stalls and RSI diverges
- Target: 22,800–22,600
- Use tight stops above 23,500
