- NQ full of bullish sentiment as the end of the year approaches.
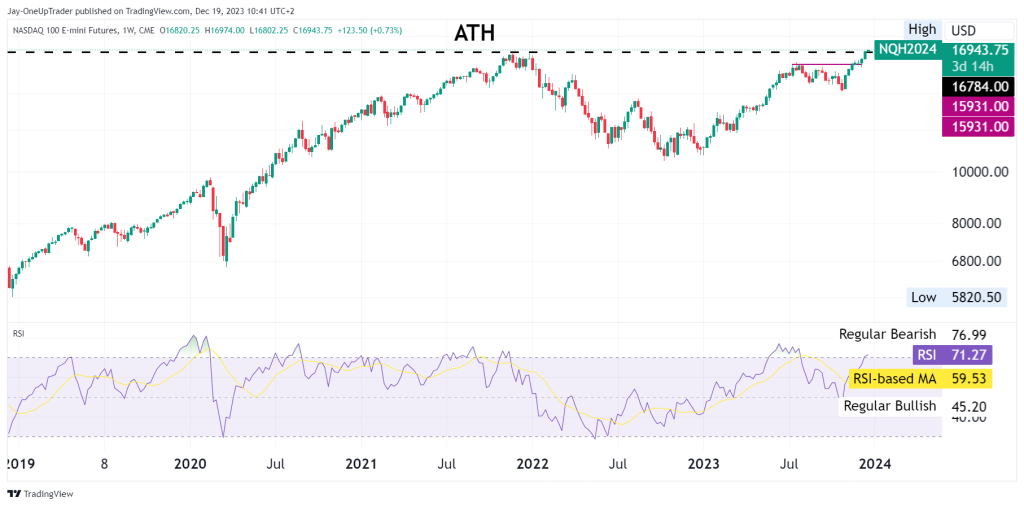
- Weekly chart has RSI in overbought territory as ATH is breached.
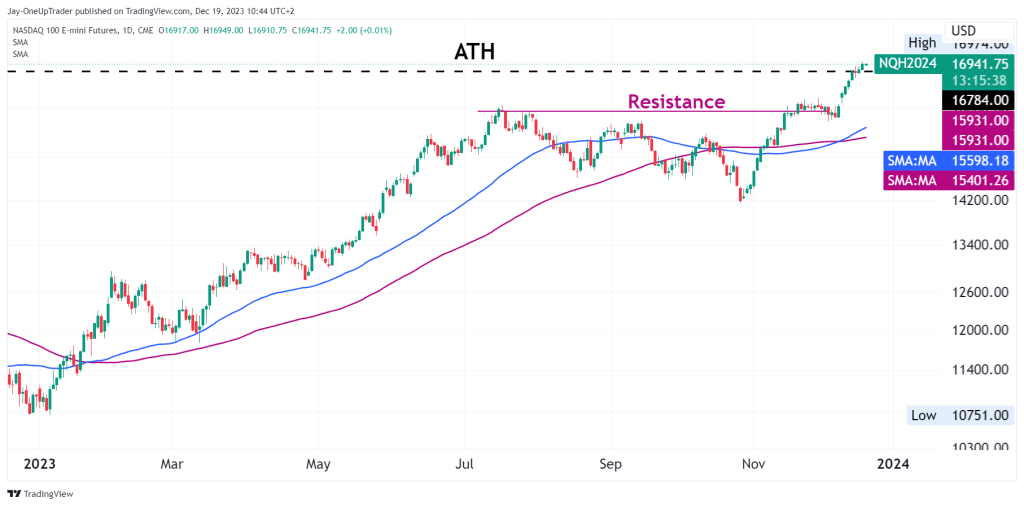
- Daily chart golden cross.
Introduction
NQ, like the rest of the world’s stock markets, is surging. Now trading at an all-time high. This week might be the first weekly close above the all-time high, which marks an incredible recovery after a 37% decline from its previous high back at the beginning of 2022. Let’s see what the charts tell us.
Weekly Chart
Below is a 5-year weekly chart. The RSI is overbought, but this is looked at as a bullish signal because the market is breaking all-time highs. We may just see the RSI on the weekly remain overbought for a while, but this week’s close is very important. If we see a swift reversal and bearish candlestick formation, it could send fear through the market, which could spring a series of profit-taking. It looks however, that at the moment, we will see the opposite. Bulls are in control, and there is nothing in their way at the moment. We can’t really set targets moving higher yet, but we can employ a scaling strategy to buy on lower time frames as the market moves higher. Sentiment is certainly bullish, and selling short now may be premature before we see a confirmation.
Daily Chart
The daily chart shows a recent golden cross of the moving averages. There is also a bullish break above a resistance zone at $15,980. We have already seen two daily closes above the all-time high at this point. Let’s see what the rest of the week will give us. If traders were to take longs here, stops could be placed below $16,600.
Note
Remember that we are closing in on the end of the year now, and liquidity will be thin. Stick to strict risk management rules and follow your trading plan. Make sure to position yourself correctly for the new year. Without overexposing yourself.