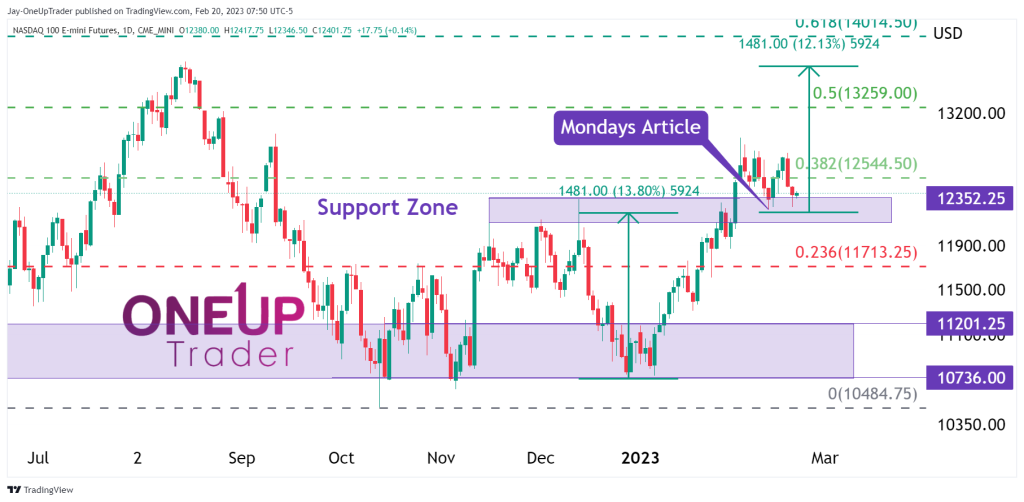
- The double bottom chart pattern is still in play from last week’s analysis.
- What happens if NQ does break below $12,200?
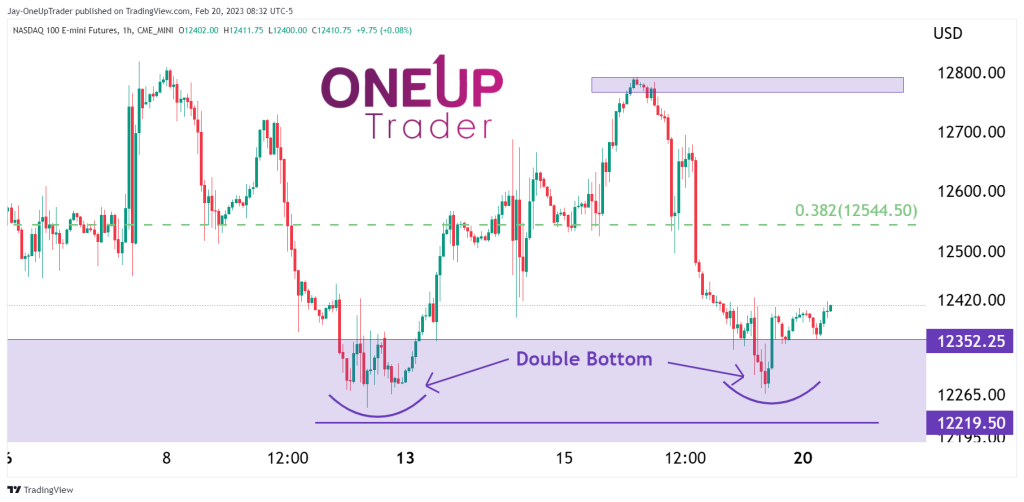
- Double bottom within double bottom can be seen on the smaller time frames.
Technical recap
Last week Monday, I stated how we can likely see a rally out of the support zone at $12,352. Price rallied shortly after the article forming three green candles in a row.
Price has retraced once more into the support zone, giving the bulls a second chance to get long. Our outlook and targets remain the same, with $13,600 still on the table. If price does drop below $12,200, then we would have to strongly re-evaluate our position because it would be breaking structural support at that point and could lead to a free fall to the $11,713 (0.236) Fib level.
Double Bottom within Double Bottom
When we see a double bottom form within a support band, it’s a far more bullish sign than if the pattern formed elsewhere. Grinding down into a shorter time frame, I can see a double bottom forming inside of the original one on the larger time frame above. This gives us 3 catalysts to improving our probabilities and expectancy for taking a position.
Taking longs around this level could see price move higher over the next few days or weeks, up toward $12,800. As I mentioned above, if price moves below $12,200, it would break the support structure, and the trade direction would quickly change to bearish. From here, traders can either take longer-term positions, closing them before the end of the day and then re-opening them, or simply ignore all short signals on their already developed strategies.