- NQ dropped 37% from its peak back in Nov 2021 and has rallied 33% from its low in Oct 2022.
- Monthly, weekly, and daily charts all show a bullish bias.
Is the bull market back?
NQ dropped over 37% from its peak back in November of 2021 to its low made in October of 2022. This, by definition, is enough to confirm a bear market. In order for us to confirm the new bull market, we need to see prices rally and remain above 20% from its lows. NQ is up 33% and continues to climb, indicating that the chances of the lows of $10,800 being tested is slim unless we see a black swan event.
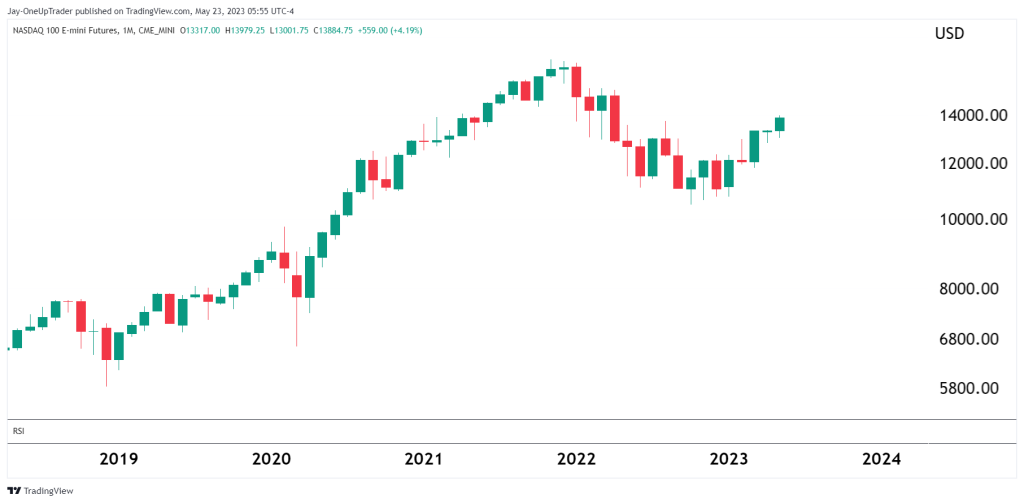
Monthly Chart
Looking purely at price action, the monthly chart looks like a clear retracement continuation pattern.
The price action is bullish.
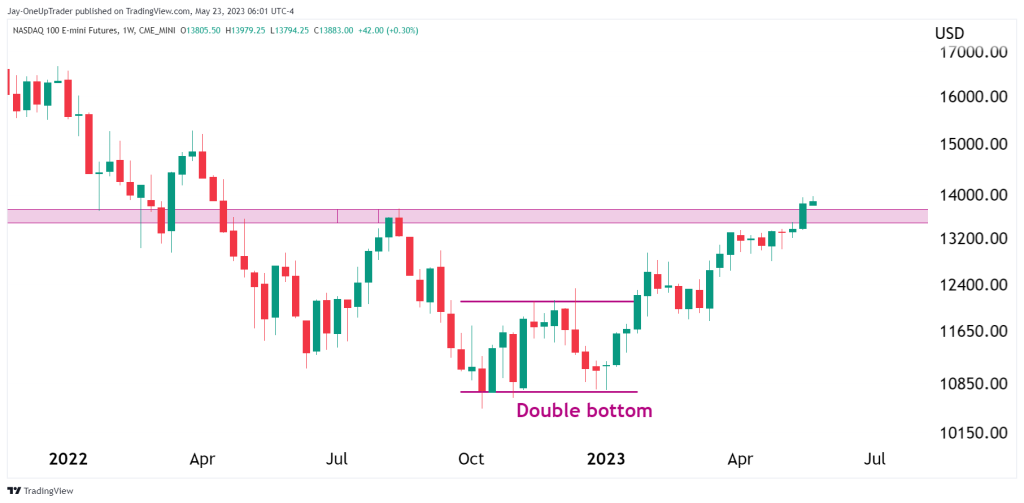
Weekly Chart
The weekly chart shows similar bullish momentum but has signs that NQ is overbought for the time being. The RSI is approaching overbought, but we are in a trending environment for NQ, so we need to keep in mind that the RSI can remain in overbought territory for a while. Chasing the market here would not be a good idea, so waiting for a 3-5% pullback may be the best best for bulls. The double bottom we mentioned in the previous article gives us a nice base too.
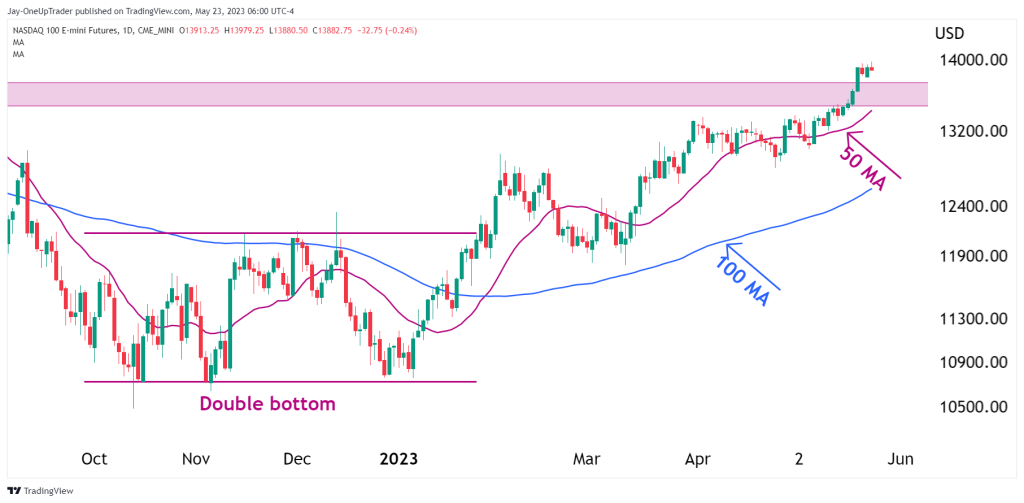
Daily Chart
The daily chart is trending. Price is above the 50 and the 100 moving average. Small dips get bought up frequently. This gives us a bullish bias overall for NQ but as already mentioned, we must not chase the market.