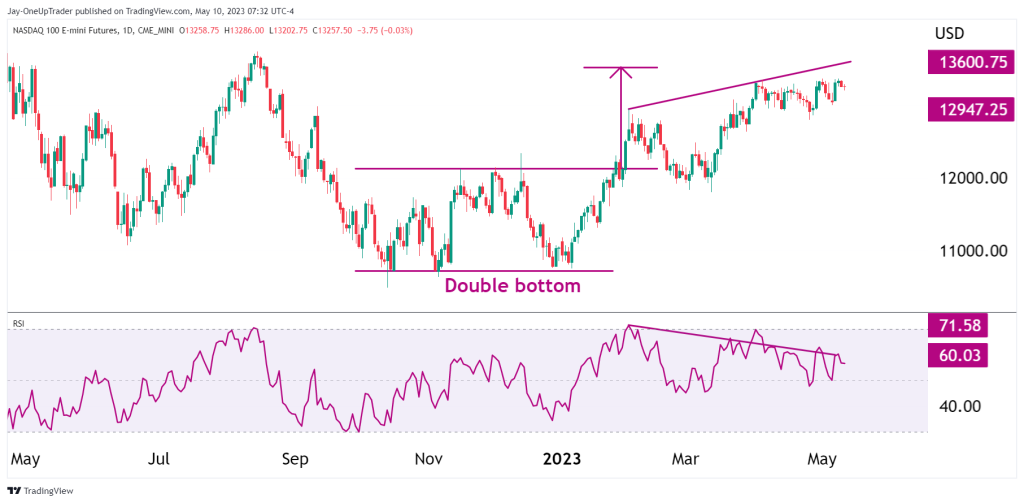
- RSI shows signs of bearish divergence.
- Price squeeze on the daily chart tells us that longs should be avoided.
- CPI report today could give new legs to NQ.
Technical analysis
RSI: The rsi is the indicator showing bearish divergence in the daily chart. Looking at the chart below, the divergence is strong, and this tells us that we shouldn’t consider taking long positions.
Squeeze: The price action has been squeezing toward the top of the recent move. This indicates less buying pressure is present, and there will eventually be a break out in either direction.
Double bottom: The double bottom, which formed toward the end of last year and the beginning of this year, has now concluded with the target being hit. This is another bearish sign.
Technical round up
The recent price action in NQ tells us that long trades should be avoided until we have a clearer higher high forming. At the moment, the squeeze paired with the bearish divergence means it’s a time to sit on our hands. CPI numbers today could give NQ a new direction too.