

Introduction
Its been exactly 400 days since the the 50 simply moving average crossed back above the 200 simple moving average in a 100% rally from bottom to the top in NQ. The index has rallied hard and technicals are still pointing to higher prices as the bulls over power the bears.
Technical analysis though limited can give us a probabilistic outlook on the markets by looking at patterns that have occurred before. When it coms to the daily chart of US indexs, we have seen nothing but huge bull runs since 2008 except for the covid crash and the 37% retracement late 2021. Have long term bear markets ended? Is it time to adjust our strategies to account for shallower retracements instead of the deep ones we saw before 2008?
Technical Analysis
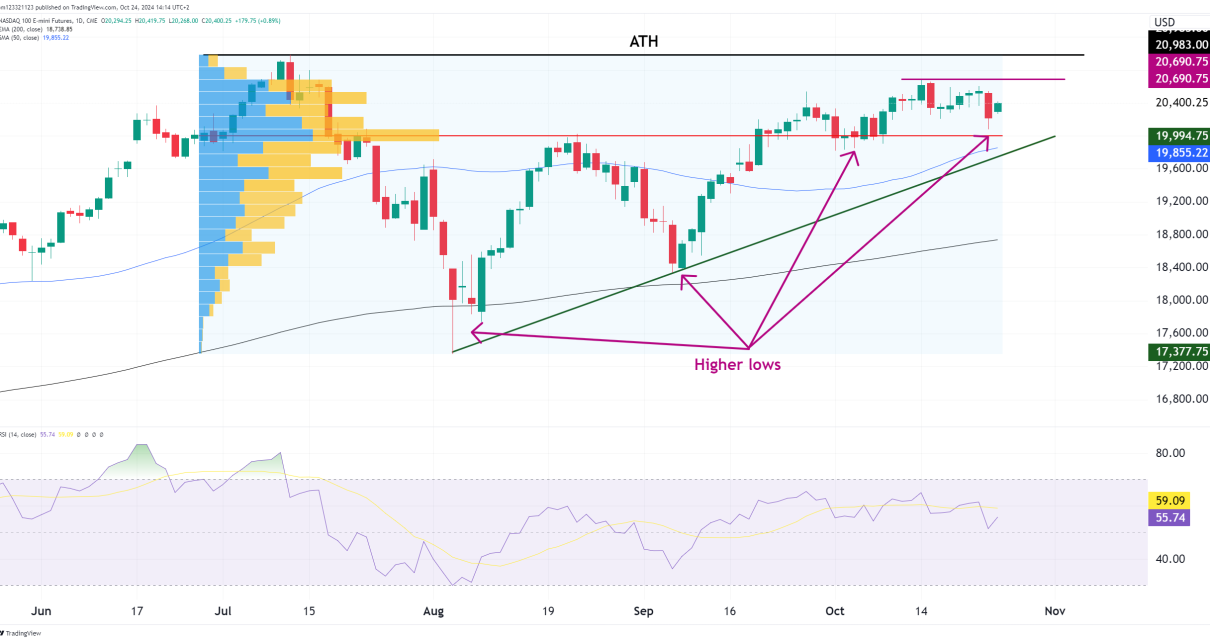
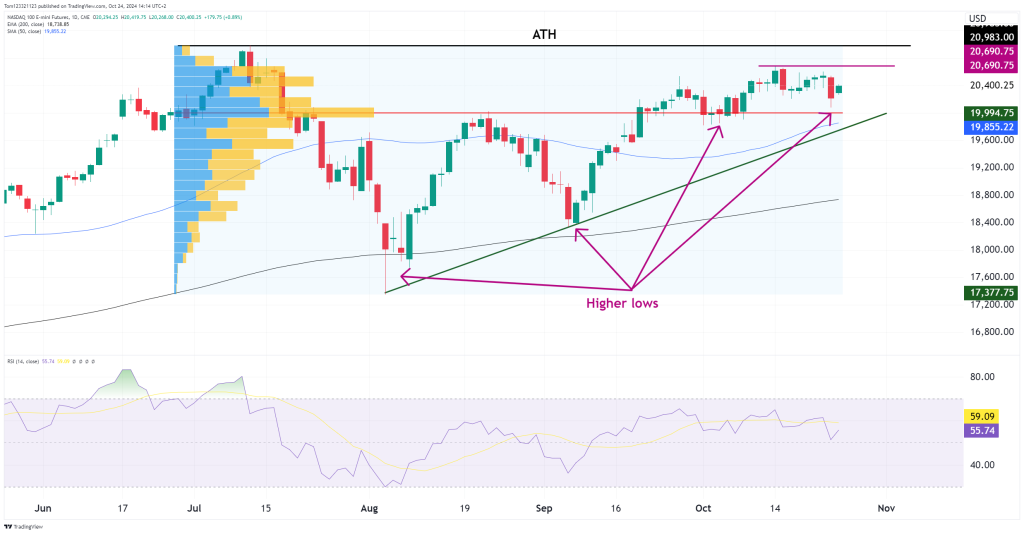
There is an ascending triangle formation on the daily chart where price has continued to make higher lows. normally ina formation like this we see buying interest accelerate higher toward the end of the formation and bulls push the price above the resistance zone which leads to a spike in the price. From there, the market can either continue with the bullish price action or it can retrace and fail.
The volume profile indicator also shows tons of support on the point of control level highlighted in red. We can note this level as a possibly entry point.
Technicals To Take Note Of
- Higher Lows and Uptrend Line:
There’s a clear uptrend forming with higher lows (marked on the chart), and the price is respecting this upward trendline. As long as the price remains above this trendline, the market is technically in a bullish pattern. A break below this trendline could signal a reversal and provide a shorting opportunity. - Relative Strength Index (RSI):
The RSI is currently around 59.11, which is in neutral to slightly bullish territory. It is below overbought conditions (70), meaning the market has room to move higher. However, if the RSI dips below 50 or shows bearish divergence, that could indicate weakening momentum.
Trade Opportunities:
1. Long Trade: Breakout Play
- Entry Trigger: If the price breaks above the resistance level near the ATH (20,983), enter a long trade.
- Target: Look for a continuation move to the upside, potentially aiming for new all-time highs. You could target 21,500 as the first level.
- Stop-Loss: Place a stop-loss slightly below the breakout level (around 20,690) to limit downside risk.
- RSI Check: Ensure that the RSI stays above 60-65 during the breakout to confirm momentum.
2. Long Trade: Bounce from Support
- Entry Trigger: If the price pulls back to the trendline near 19,850 or the volume profile area and shows bullish price action (e.g., a bullish candlestick pattern or a bounce off the 50-day moving average).
- Target: Aiming for a return to test the ATH resistance at 20,690 or beyond.
- Stop-Loss: Set a stop-loss just below the trendline or below 19,600 to protect against a deeper correction.
- RSI Check: Ensure that the RSI stays above 50 to confirm the strength of the bounce.
3. Short Trade: Rejection at ATH or Breakdown
- Entry Trigger: If the price fails to break the ATH and shows rejection (e.g., a bearish candlestick pattern like a shooting star or a bearish engulfing pattern), consider a short trade.
- Target: Look for a drop to the support level near the trendline or the 50-day moving average at around 19,600.
- Stop-Loss: Place a stop-loss above the previous high (20,983) to avoid being caught in a breakout.
- RSI Check: If the RSI starts to roll over from current levels or shows divergence, it could confirm a bearish move.
4. Short Trade: Trendline Break
- Entry Trigger: If the price breaks below the rising trendline and closes below 19,850 with increasing volume.
- Target: The next support area is around 19,000, so you could target this level.
- Stop-Loss: Place a stop-loss above the trendline to prevent loss from a false breakdown.
- RSI Check: Look for the RSI to drop below 50 to confirm weakening bullish momentum.
Timeframes:
- Short-Term (1-2 weeks): The market seems to be in a consolidation phase near a resistance zone. A breakout above the ATH could lead to a short-term rally.
- Medium-Term (2-6 weeks): As long as the trendline of higher lows holds, the bias is bullish. However, a breakdown below this could initiate a medium-term correction.
- Long-Term (3+ months): The market remains in an overall uptrend. Unless we see a significant breakdown below the 50-day and 200-day moving averages, the long-term bullish bias remains intact.
