

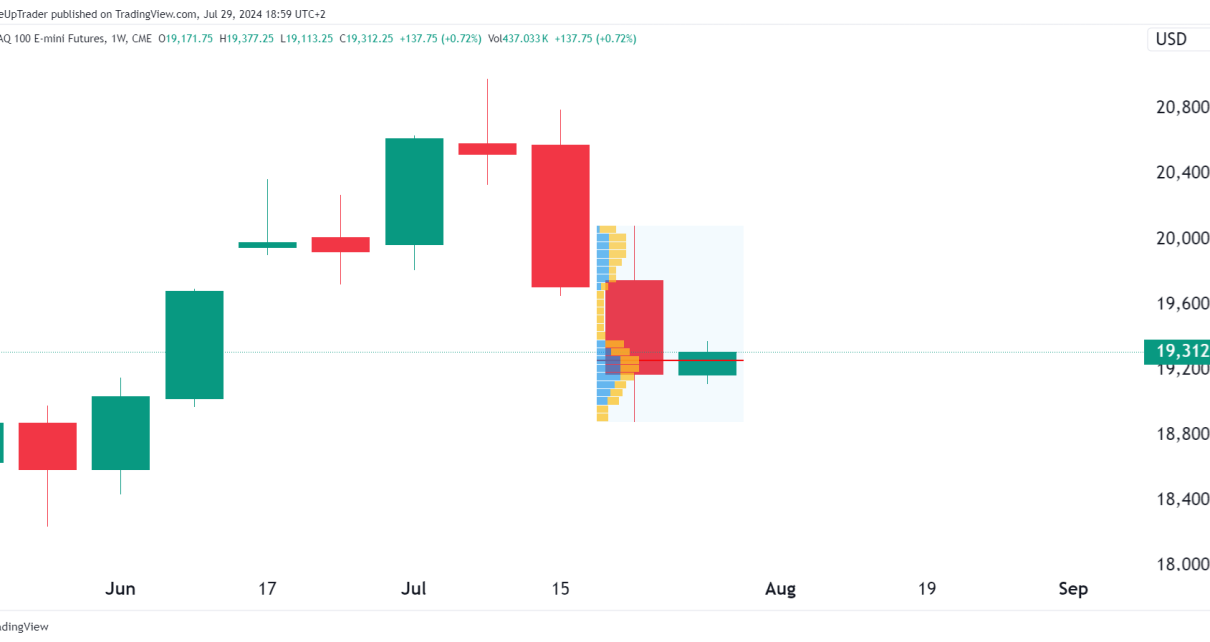
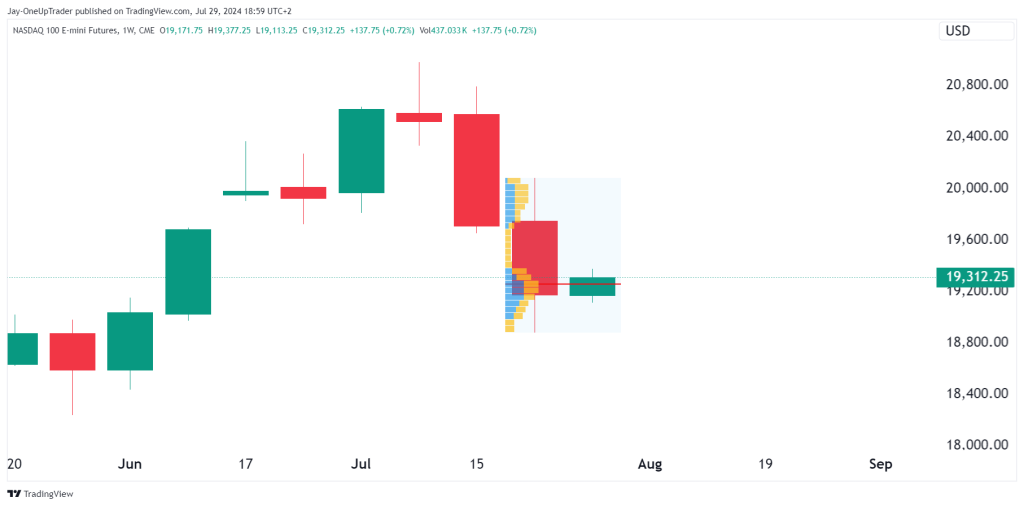
Weekly Chart
I have put a volume profile indicator onto last weeks trading which is shown in the weekly chart below. Price is sitting now just above the support where last weeks candle closed. The Point of control line is holding the price up for now and after the recent dip in the US equity markets, we could see the new leg up from here. Price must hold above last weeks low however ($18,886) and preferably above the point of control line.
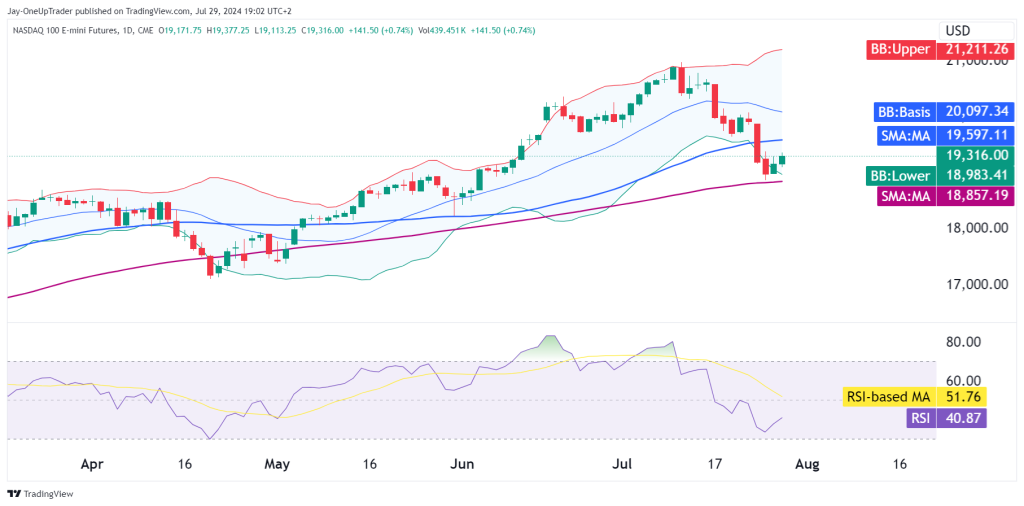
Daily Chart
Looking at the daily chart, it appears that the pullback has been completed, and if the pattern repeats, we should see a surcharge in buying come in from here. Price is below the Bollinger band, and the bands have widened during the sell-off, and the RSI is near oversold.
We may see price sit a few more sessions sideways before a move up but as said above, price must remain above last weeks low for the bull case to be in tact.
If you have any technical analysis or a great trade you took with an explanation of your process, please send it to us via our Instagram here or email [email protected] or [email protected]. The trader who sends the best analysis/trade that week will receive a 25% discount code to use on any Evaluation.


