


Introduction
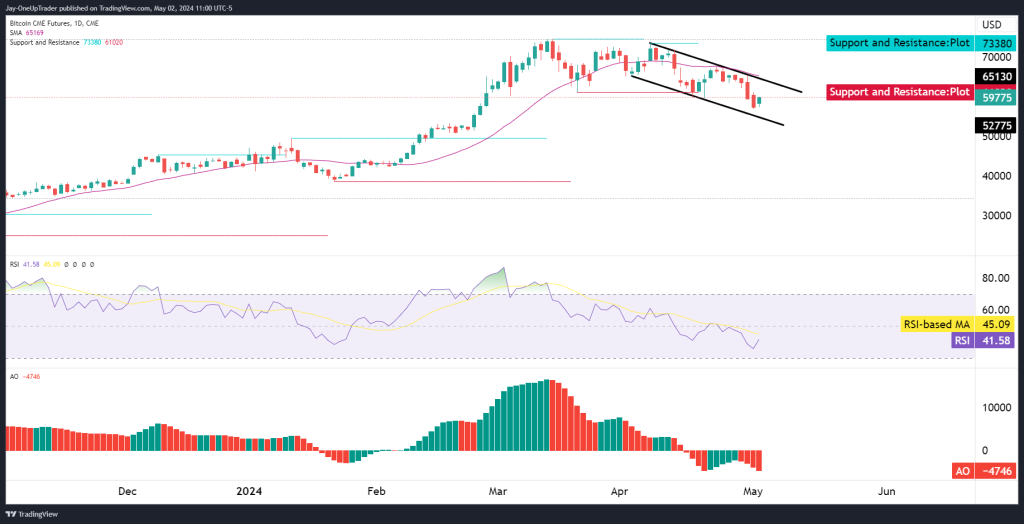
Based on our analysis this week, we can see that Bitcoin is currently in a short-term bearish trend after a big pump at the start of the year. There is a descending channel pattern starting from late March. This pattern is characterized by consistent lower highs and lower lows within the channel.
Support and Resistance Levels
When we look at the support and resistance levels, the first major resistance is around 70,000 USD, which aligns with the upper trend line of the descending channel. On the support side, we have a critical level at approximately 59,700 USD (the price that BTC is currently trading at). If the price breaks below this level, we could see it heading towards the next major support at 52,775 USD.
Moving Average and Momentum Indicators
The 21-day Simple Moving Average, represented by the pink line, initially acted as a support. However, as the trend progressed, the price fell below this moving average, which means it could now act as a dynamic resistance level.
The Relative Strength Index is currently just above 40, which doesn’t indicate overbought or oversold conditions. However, it’s in a downtrend, which might suggest a weakening momentum in the price. Similarly, the Awesome Oscillator (AO) shows decreasing momentum with the histogram moving from green to red, further supporting the bearish sentiment.
Short, Medium, and Long-Term Outlook
Short-Term (Days to Weeks)
In the short-term, we have a bearish inclination given the descending channel and the recent break below the 50-day SMA. As traders, we might expect further downside unless there’s a decisive breakout above the channel.
Medium-Term (Weeks to Months)
For the medium-term, if the price sustains below the SMA and fails to breach the upper channel line, the outlook remains bearish. We need to keep an eye on the support levels at 59,775 USD and 52,775 USD.
Long-Term (Months to Year)
The long-term outlook will depend significantly on how the support at 59,700 USD holds. A rebound from this level could signal a potential reversal, but continued pressure could lead to a test of lower supports.
Trading Strategy
Bearish Scenario
In a bearish scenario, a breakdown below 59,000 USD could offer a short-selling opportunity with targets near 52,775 USD.
Bullish Scenario
However, in a bullish scenario, a breakout above the descending channel, particularly above the 70,000 USD resistance, would be a bullish signal, potentially aiming for higher price levels.

