

- YM has surged 23% from October lows.
- Ascending triangle breakout targets $38,000; pullback potential at $34,702.
- RSI retraced to 54, supporting bullish interest; trade opportunity on support bounce.
Introduction
As with most equities this year, YM has seen a resilient surge of 23% since last year’s lows made in October. The ascending triangle pattern on the daily chart has been the primary focal point for our technical analysis as we try to find favorable risk-reward ratios and high-probability trades. Let’s take a fresh look at the YM technicals.
Technical Analysis
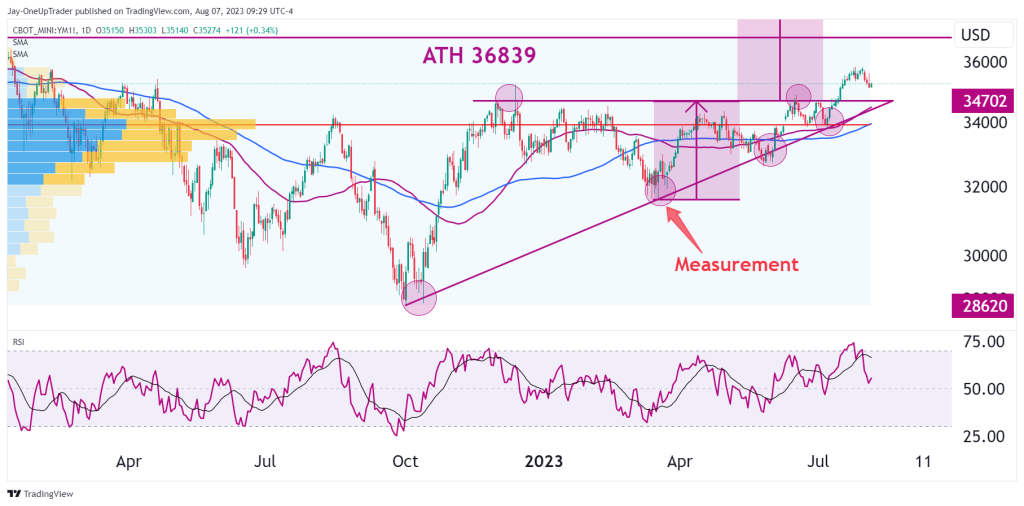
Ascending Triangle: This pattern has 6 main connection points, which I have marked with circles on the chart below. It’s a bullish formation, and since the price has already broken through the resistance ceiling, we can extend the target from measuring the triangle at the second connection on the diagonal support line. Commonly, we see a pullback after the breakout occurs back to the previous resistance level to see if it will hold as support. This could be happening right now, and if we do notice that price is holding at that level ($34,702), then we could potentially look for new entries. Targets for this formation would be around $38,000, which is above the all-time high.
RSI: The relative strength index has had a healthy retracement back to 54 after being in overbought territory. There is no sign of bearish divergence and this tells us that there is still strong bullish interest.
Trade Ideas
The strongest trade opportunity I see on the chart now is the possible retracement to the horizontal resistance line that has now turned to support. A bounce off that line in the form of a candlestick pattern or period of consolidation could the signal that bulls have been waiting for.

