Introduction
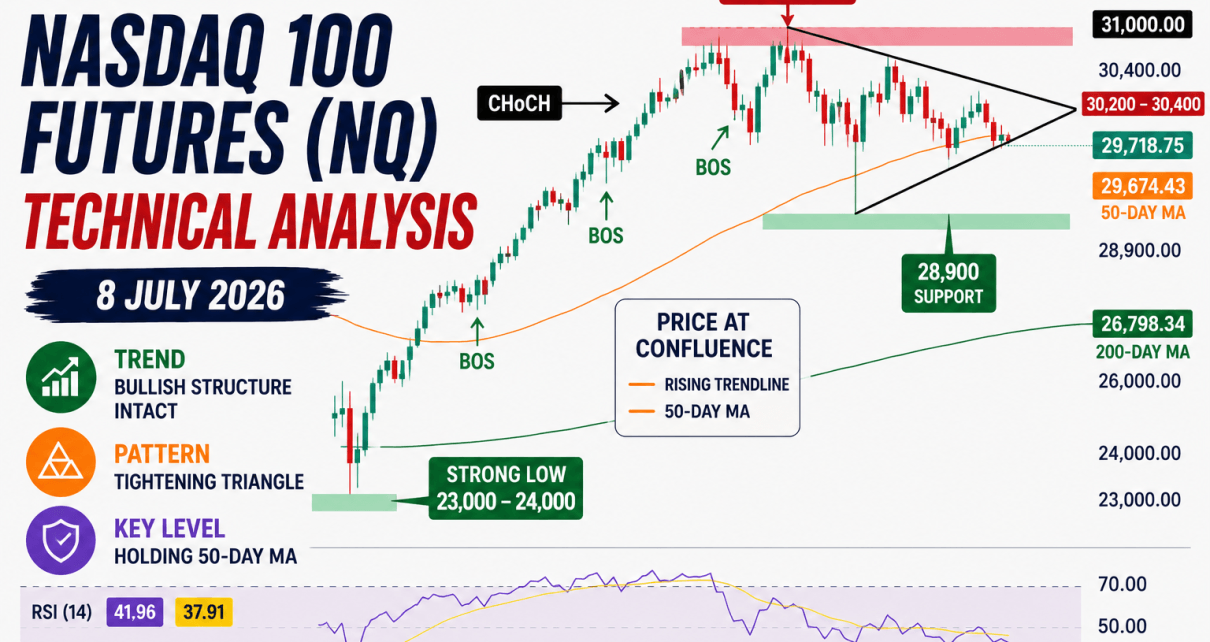
Nasdaq 100 futures are still consolidating below their June highs, but the structure on the daily chart is starting to take shape. Price closed at 29,718.75, holding just above the rising 50-day moving average after bouncing off a fresh swing low earlier this week. The bigger question is whether this is basing for another leg higher, or just a pause before a deeper pullback.
Let’s break down what the chart is showing and where the key levels sit.
Join Our Discord & Receive a 20% Discount!
Nasdaq 100 Futures Trend Analysis
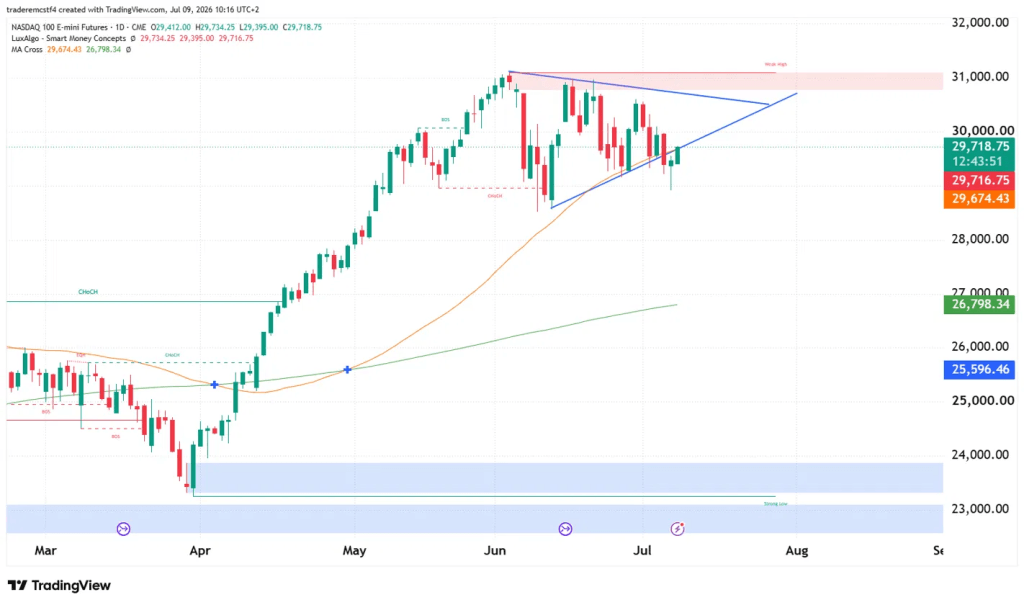
NQ printed a strong bullish trend from April through early June, marked by a series of clean break-of-structure (BOS) moves as price pushed from the April low all the way to a high near 31,000. That move stalled out in mid-June with a change of character (CHoCH), where price broke down out of the prior bullish structure for the first time since the rally began — the first real signal that buyers were losing control at the highs.
Since that CHoCH, price has been carving out a broadening-then-tightening range beneath the June high, which TradingView’s structure tools are flagging as a “weak high” — a high that hasn’t been decisively confirmed and remains vulnerable to a retest or a sweep. Price is now pressing against a rising trendline off the most recent swing low, with the 50-day moving average (29,674.43) sitting almost exactly at current price. The 200-day moving average (26,798.34) is much further below and still rising steadily, confirming the longer-term uptrend remains structurally intact even with the recent chop.
Put together, this reads as a market working through a corrective phase within a larger uptrend — not distribution that’s about to fail outright, but not a strong trend either. The converging price action (higher lows into a flat-to-lower high) is classic triangle behavior, and the resolution of that triangle is likely to set the tone for the next several weeks. From here, bulls want to see price move back inside of that triangle.
Key Support and Resistance Levels
Major Resistance
| Level | Notes |
|---|---|
| 31,000 | June high, marked as a “weak high” — needs a decisive close above to be trusted |
| 30,200 – 30,400 | Prior consolidation zone from mid-June, first hurdle on the way back up |
Major Support
| Level | Notes |
|---|---|
| 29,674 | Rising 50-day MA, confluence with the current triangle’s lower trendline |
| 28,900 | Recent swing low / CHoCH level — a break here would undo the current base |
| 26,798 | 200-day moving average |
| 23,000 – 24,000 | “Strong low” zone from the April low — major structural support, worst-case reference |
Nasdaq 100 Futures Possible Trades
Range/Triangle Trade Setup With price coiling between the weak high near 31,000 and the rising trendline off 28,900, the cleanest approach is trading the edges rather than guessing the breakout direction early.
- Bullish scenario: A bounce off the current trendline/50-day MA confluence (29,674) with a bullish reaction candle offers a long entry, targeting a retest of 31,000.
- Bearish scenario: A daily close back below 28,900 would confirm the CHoCH low has failed to hold, opening the door toward the 200-day MA (26,798) as the next real support test.
- Trigger: Wait for confirmation at either edge — a rejection wick or reversal candle at support, or a clean close through 31,000 for the bullish breakout case. Given the “weak high” tag, a spike above 31,000 that immediately reverses should be treated with suspicion rather than chased.
- Invalidation: A sustained move back inside the range after either a breakout or breakdown attempt signals a fakeout rather than genuine continuation.
Breakout Continuation Setup (if bullish resolution confirms) A confirmed close above 31,000 with a retest that holds as new support would offer a lower-risk continuation entry, aligned with the broader uptrend defined by the rising 200-day MA.
Summary
NQ remains in a corrective, range-bound phase after the mid-June change of character, with price currently testing the rising trendline and 50-day MA near 29,674. The broader trend is still intact — the 200-day MA continues to climb, and the recent CHoCH looks more like a pause than a reversal so far. The 28,900 level is the one to watch on the downside; holding it keeps the base building intact, while a close below it would shift the near-term bias more defensive. On the upside, 31,000 remains the level that needs to be reclaimed and held before the broader uptrend can be considered fully back in control.
This analysis is provided for educational and informational purposes only and should not be considered financial or trading advice. Trading futures, forex, and other leveraged financial instruments carries a high level of risk and may not be suitable for all investors. Past performance is not indicative of future results. Before making any trading decisions, conduct your own research, assess your risk tolerance, and consult with a qualified financial advisor if necessary.