Introduction
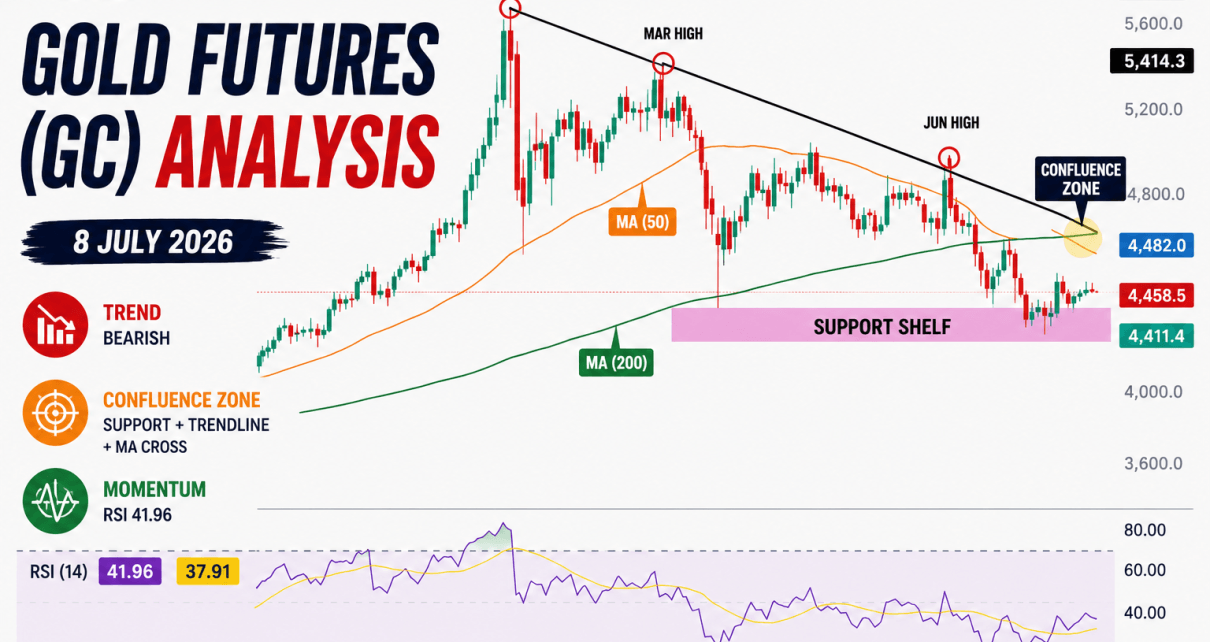
Gold futures have spent the past five months unwinding a powerful rally that took the metal from roughly 2,900 in December to an all-time high near 5,414 in February. Since that peak, bears have carved out a persistent downtrend, and gold is now trading at 4,458.5 — testing a zone where a long-term support shelf, a multi-month descending trendline, and a moving average cross are all converging at once.
Let’s take a closer look at the GC chart and see if there are any possible trades we can take.
Gold Futures Trend Analysis
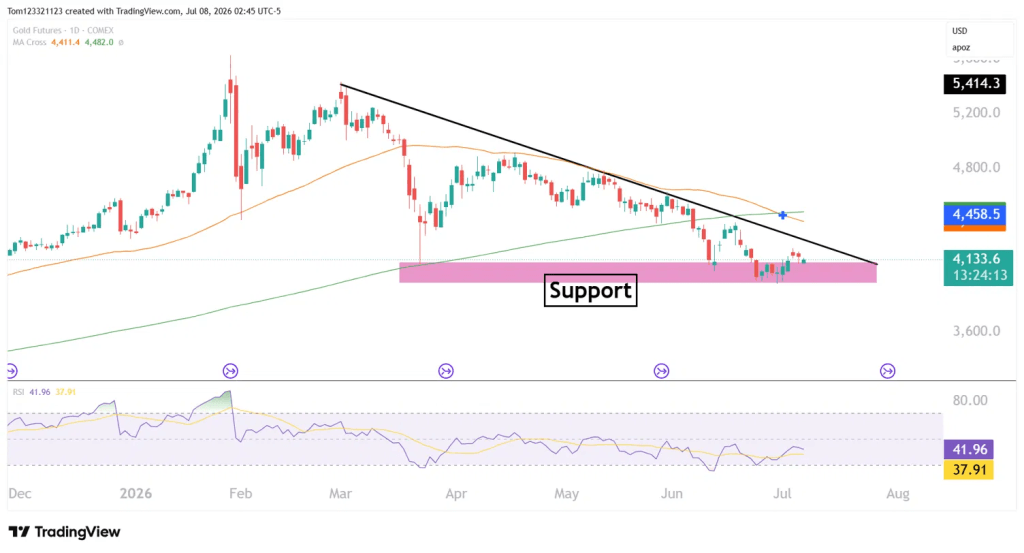
The dominant structure since February has been a clean downtrend, with lower highs stepping down from 5,414 through the March, April, and June rejection points. Price is currently trading at 4,458.5, just above the shorter-term moving average (4,411.4) but below the longer-term moving average (4,482.0) — the two have been converging for several weeks after the shorter MA crossed below the longer one back in April, and they’re now nearly flat and tangled together, which often signals a trend losing downside momentum rather than one accelerating.
RSI is sitting at 41.96, with its signal line at 37.91. Momentum spent April through June pinned in the low-30s to mid-40s range — persistently soft, consistent with the grinding sell-off — but RSI has been curling higher off recent lows alongside the last few weeks of price action, hinting that selling pressure may be easing even though it hasn’t flipped bullish.
The most important technical feature on this chart is the confluence forming right now: the multi-month descending trendline (connecting the February, March, and June highs) is intersecting almost exactly where price is testing the top of a well-established support shelf. That kind of overlap — trendline resistance meeting horizontal support — often precedes a decisive move, since it forces the market to choose a direction rather than continue drifting sideways.
Join Our Discord Server For Exclusive Discounts & Giveaways!
Key Support and Resistance Levels
Major Resistance
| Level | Notes |
|---|---|
| 4,482 | Longer-term moving average, immediate overhead level |
| 4,800 | Prior consolidation zone from May, first real resistance above the trendline |
| 5,200 – 5,414 | February all-time high area, major long-term resistance |
Major Support
| Level | Notes |
|---|---|
| 4,411 | Shorter-term moving average, minor intraday support |
| 4,133 | Recent swing low, first support below current price |
| 3,900 – 4,150 | Multi-month support shelf, tested repeatedly since April |
Gold Futures Possible Trades
Breakout Trade Setup With the descending trendline and the support shelf converging, the highest-probability play is waiting for price to commit to one side of this squeeze rather than anticipating it.
- Bullish scenario: A daily close back above the descending trendline and the 4,482 moving average would suggest the five-month downtrend is losing control, opening the door toward a retest of 4,800.
- Bearish scenario: A break below the 3,900–4,150 support shelf would confirm sellers remain in charge, likely accelerating the move toward new lows for the year.
Trigger: Wait for a clean daily close outside this confluence zone rather than reacting to an intraday touch — support/resistance overlaps like this are prone to false pokes in both directions before a real move develops.
Invalidation: A quick failure back inside the trendline/support zone after an apparent breakout would suggest a fakeout rather than a genuine shift in trend.
Range Trade Setup (while confluence holds) Until one side breaks, the shelf itself offers a tactical range: fading toward the top of the 3,900–4,150 zone on strength, or looking for a bounce from the lower end of that shelf, with tight risk given how compressed the structure has become.
Ready To Get Funded? Sign Up Today!
Summary
Gold remains in a broader downtrend from its February all-time high, but price is now testing a genuine confluence zone where a long-term support shelf meets a multi-month descending trendline, while the moving averages tangle and RSI curls higher off soft momentum readings. A daily close above the trendline and 4,482 would be the first real sign of trend exhaustion, while a break below the 3,900–4,150 shelf would confirm the downtrend has further to run.
This analysis is provided for educational and informational purposes only and should not be considered financial or trading advice. Trading futures, forex, and other leveraged financial instruments carries a high level of risk and may not be suitable for all investors. Past performance is not indicative of future results. Before making any trading decisions, conduct your own research, assess your risk tolerance, and consult with a qualified financial advisor if necessary.