- Bulls test the resistance level of ascending triangle as all major US indices rally.
- A bearish case is possible if a resurgence in selling pressure occurs.
Technical analysis
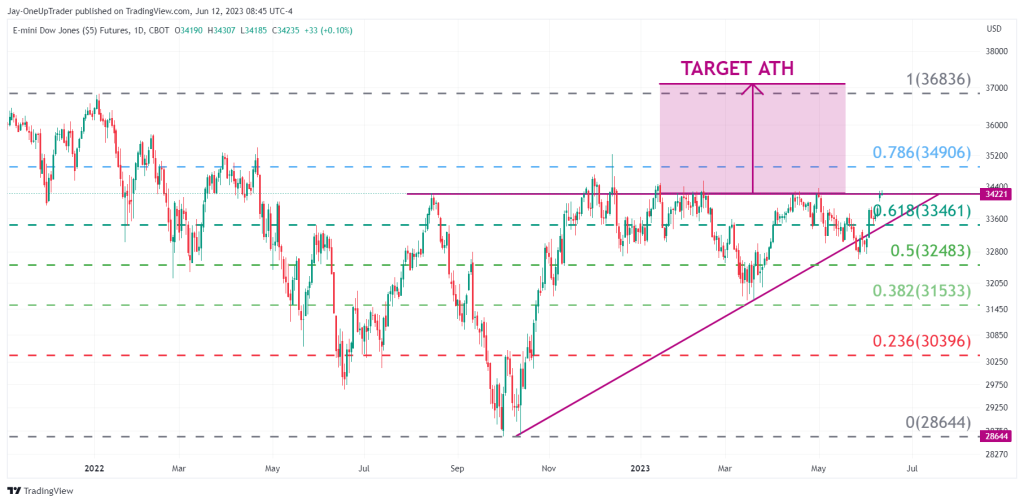
Like all other US indices, YM has been surging on the back of strong US data. The Dow Jones is currently testing the horizontal resistance level of an ascending triangle formation on a daily time frame. The question is whether bulls will be strong enough to be able to push price through current prices of $34,200. If the bulls are victorious, we can extend a profit target by measuring the ascending triangle, as shown in the charts below. This gives us a target of $36,838, which is the all-time highs.
Bearish case
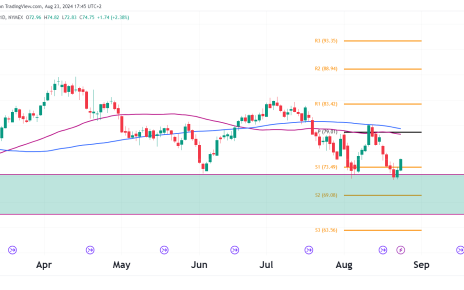
If there is a resurgence in selling pressure, we could see price fall back down toward $33,444, which is the diagonal support line and the Fib 61% level.