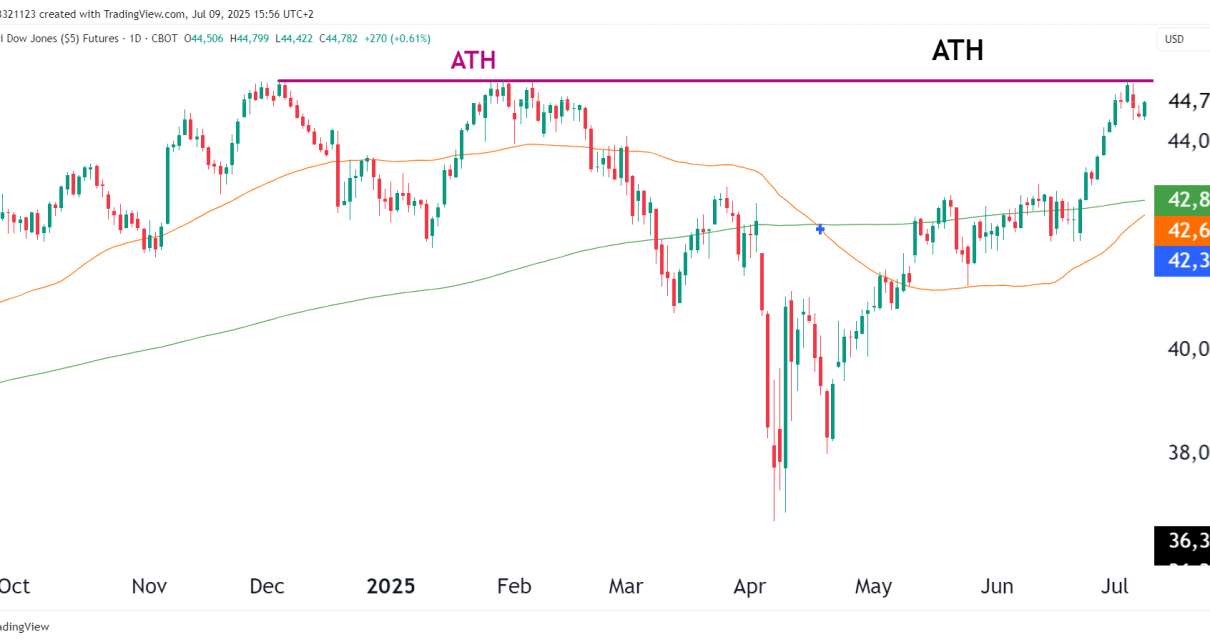
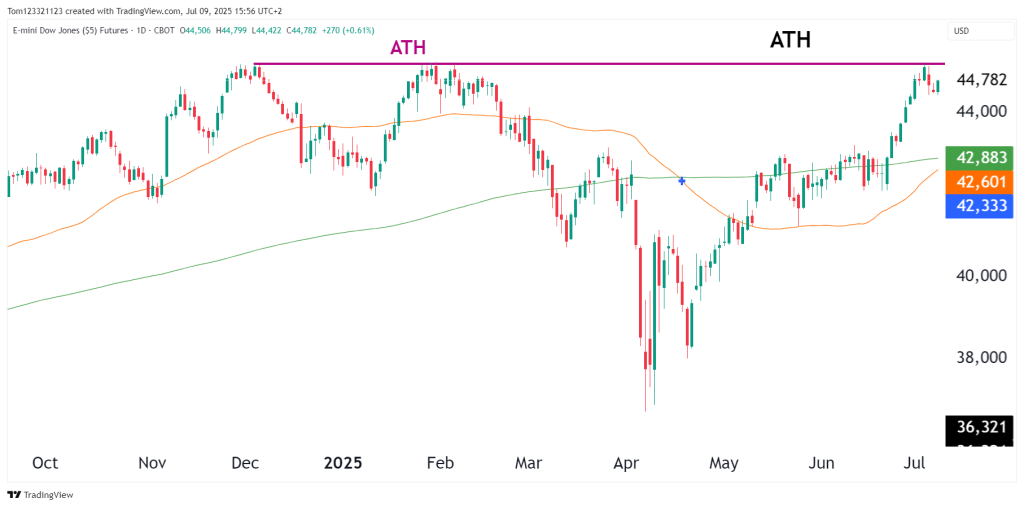
The Dow Jones E-mini futures (YM) just hit an all-time high (ATH) at 44,671, and while price action has slightly pulled back, it’s hovering right beneath breakout territory. Bulls will now be looking to see if this rally can build a base above previous resistance or if momentum will stall in the short term.
Technical Breakdown
Indicator
Current Status
Current Price
44,641
All-Time High (ATH)
45,177
20-Day MA
42,598
50-Day MA
42,333
200-Day MA
42,882
Trend
Strong bullish trend above all key MAs
YM remains above all key moving averages, showing solid bullish structure.
Price tagged the ATH and is forming a tight consolidation, which could either lead to a breakout continuation or short-term exhaustion.
Pullback remains shallow, indicating buyers are still stepping in on minor dips.
Recent Price Action Insights
The June rally was driven by macro optimism, tech sector strength, and dollar weakness.
YM broke out of its March-April consolidation range, accelerated through 43,000, and made a clean push toward ATH.
The higher low structure remains intact.
Scenario Probabilities
Scenario
Probability
Commentary
Breakout > ATH toward 45,000+
50%
Bullish continuation if consolidation base holds
Sideways consolidation near ATH
35%
Likely if no new catalyst emerges short term
Rejection & pullback toward 43,800–44,000
15%
Possible if risk-off sentiment returns or profit-taking kicks in
Aug 44,500/45,500 call spread — low IV play on breakout
Outlook Summary
Time Frame
Bias
Rationale
Short-Term
Bullish
Momentum trend intact; watch breakout volume
Medium-Term
Bullish
Structure strong above MAs and higher lows
Long-Term
Bullish
Breakout to new highs could trigger broader FOMO
Conclusion
Dow futures remain resilient, and the mild pullback after hitting the ATH does not yet signal weakness. If buyers defend this new high zone, momentum traders could push YM into uncharted territory. A short-term dip remains a buy-the-dip opportunity while the structure holds. A close below 44,000 would warrant reassessment.
Overview Crude oil has seen a sharp unwind following last week’s geopolitical-driven spike above $77. Over the past 48 hours, a de-escalation in tensions between Iran and Israel has cooled risk sentiment, pushing prices back into the prior breakout zone between $64 and $68. A rapid +20% rally driven by fear premiums has now corrected Read More…
Bulls In Control Crude Oil continues to surge as small dips are eaten up quickly by powerful buying pressure. The question here is if there is any bearish case, really. It appears that there is none, which is important to note moving forward as CL targets the psychological $100 level. In our last technical analysis, Read More…
Stay informed with our technical analysis of the S&P 500 futures. A potential formation of an evening star pattern and the struggle to break through resistance at $4033.25. Follow our analysis for insights on the market before the FED interest rate decision on January 31st. Quick recap In our analysis from last week, we looked at Read More…


