- Gold price action recap shows continued bullish sentiment.
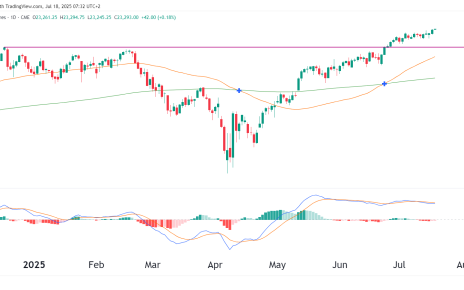
- 20 and 50 ema give bulls a potential entry on pullbacks within the ema zone.
- GDP and interest rate decisions could create turbulent times ahead.
Recap
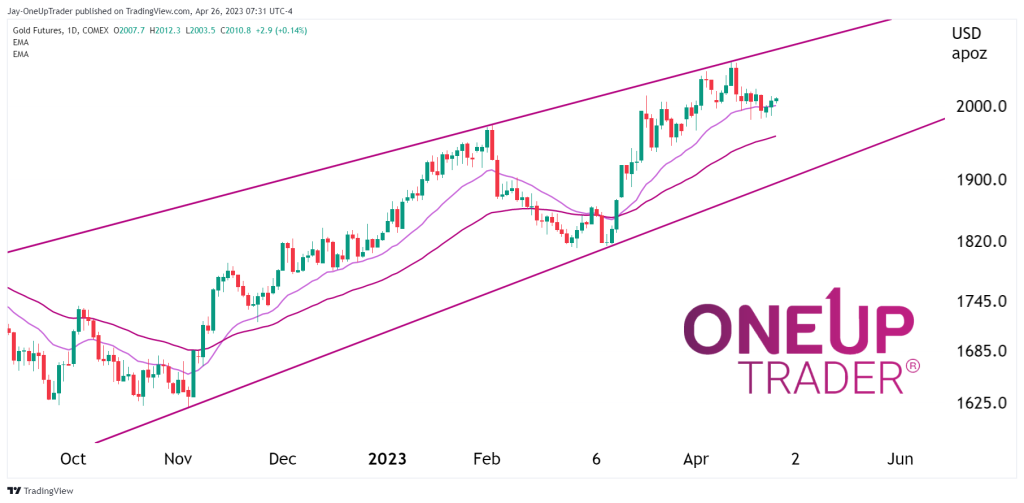
The last time we looked at Gold, we saw the price approaching all-time highs. The market is still hovering around the same level as from the time that article was posted back on April 11th. From here, we can look at what we see could be the best path forward regarding the price action in GC.
Technical Analysis
There is a bullish trend line that has formed, with the potential formation of a rising wedge which remains a bullish indication at the moment. The 20 and 50 ema are both pointing upward, and the 20 ema remains above the 50 with a decent divergence between the two. This gives Bulls a potential entry point on pullbacks. If the ema holds as support, we could look for bullish candlestick patterns to confirm the pullback may be coming to an end and then initiate a long position.
Fundmanetals to take note of
On April 27th, the US reports its GDP growth rate, and on May 3rd, the Fed has its press conference and interest rate decision. This is likely going to be a turbulent time for markets, especially the Dollar and Gold. It is recommended that traders be mindful of the upcoming releases and adjust their risk tolerance as necessary.