Introduction
WTI crude closed up 15.6% last week, which is the highest weekly close since April. There is resistance now at the 50-day MA, so the question is whether the selling power will be strong enough to push prices back down toward $70 or if the bulls will be strong enough to continue with this momentum.
Lets take a closer look at the technicals and possible trades.
Crude Oil Futures Trend Analysis
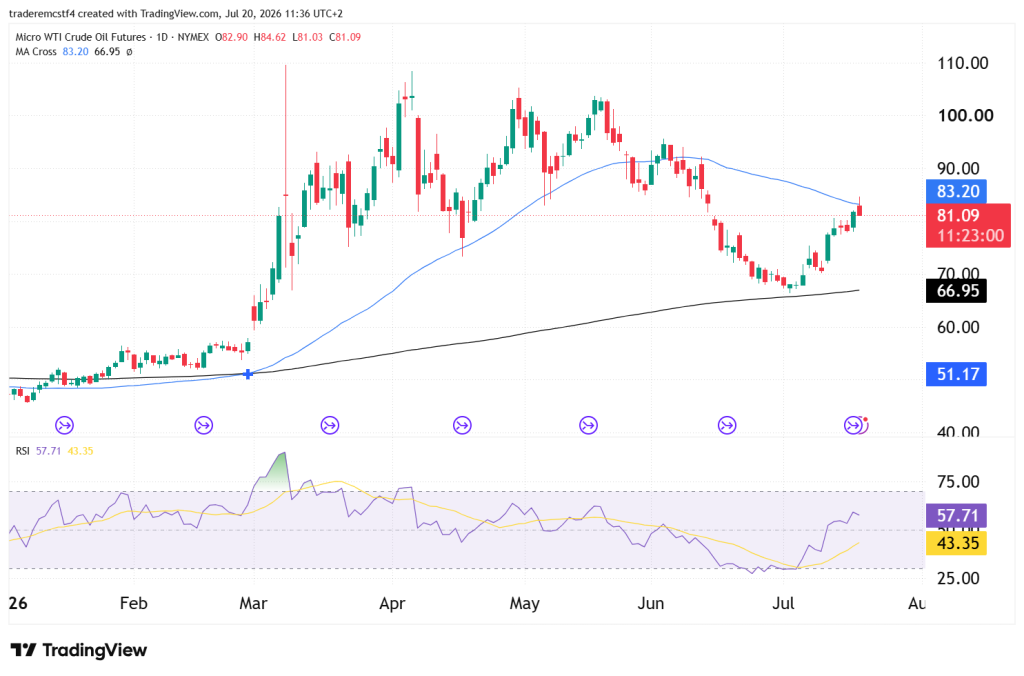
This move up has been the first decent rally that we have seen since the huge spike we saw at the early stage of the war in the middle east.
There is not much else to go by than what we have already noted for now, they key is the 50 MA. Bulls will need to push prices above it if they want to see the momentum continue, and bears will be looking for a move back lower and increasing their shorts around $80.50 – $83.
Key Levels
| Level | Notes |
|---|---|
| 90.00 | Prior consolidation zone from May–June, next resistance area if the 50-day MA is eventually cleared |
| 84.62 | Today’s high, the level that was tested and rejected |
| 83.20 | 50-day MA, today’s rejection level |
| 81.10 | Today’s low, immediate support |
| 66.95 | 200-day MA |
Possible Trades
Scenario 1: Rejection confirmed, pullback continues Today’s failed test of the 50-day MA raises the odds of at least a short-term pullback before another attempt at this level.
- Entry: Bearish reaction on a break of today’s low
- Stop: Above 84.62
- Target: Back toward the mid-70s, with the July low near 68 as a further target if weakness extends
Scenario 2: Retest and break above the 50-day MA Given the recovery in RSI since the July low, a renewed push back above 83.20–84.62 with a decisive close would suggest the bounce has more room to run.
- Entry: Daily close above 84.62
- Stop: Below 81.10
- Target: 90.00
Scenario 3: Deeper breakdown toward the July low Lower-probability near-term outcome given the recovery in momentum, but a clean break of 81.10 followed by a loss of the mid-70s would put the July low back in play.
- Trigger: Daily close below 81.10, followed by a break of the mid-70s support zone
- Target: 68–70
This analysis is provided for educational and informational purposes only and should not be considered financial or trading advice. Trading futures, forex, and other leveraged financial instruments carries a high level of risk and may not be suitable for all investors. Past performance is not indicative of future results. Before making any trading decisions, conduct your own research, assess your risk tolerance, and consult with a qualified financial advisor if necessary.