

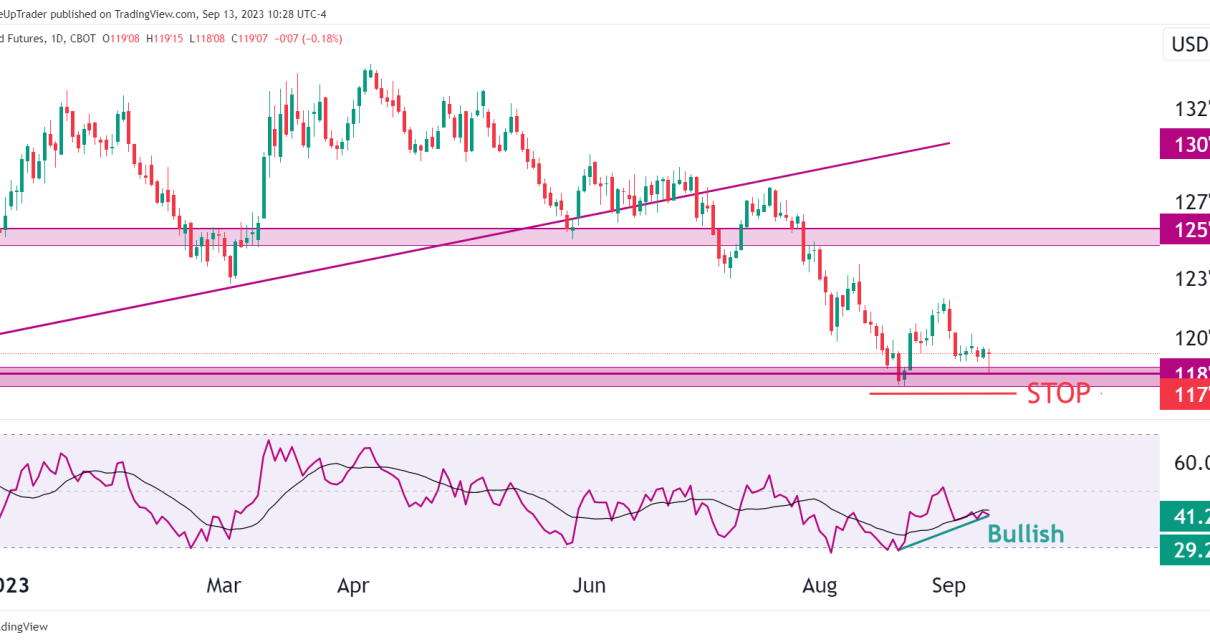
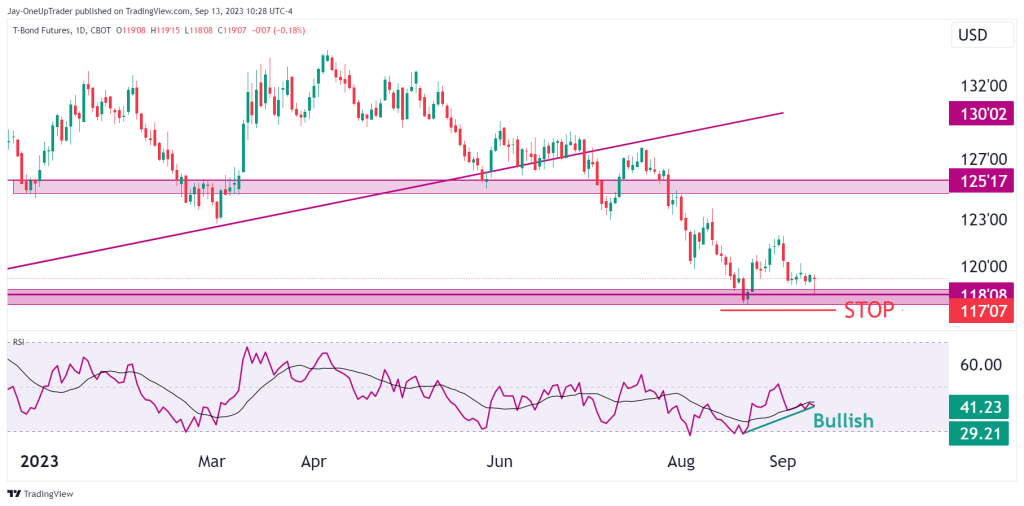
- ZB is in an overall downtrend but a possible long trade has presented itself.
- Double bottom formation paired with a support zone and a bullish candlestick adds fuel to short term bullish sentiment.
- RSI shows bullish pressure.
Recap
The last time we looked at ZB was back on August 31. Price had dropped down into a support zone and bounced with a surge in volume. Read the full article here before we move on to this week’s analysis.
Technical Analysis
ZB is currently trading within the support zone mentioned above. This has formed a small double bottom within the support zone and a potential bullish candlestick formation for today’s (September 13) close. If we look at the support zone, the volume spike, and the bullish candlestick formation, it could be enough for us to initiate long positions. Stops could be placed below the low, around 117’10. If price drops below that, then sentiment would turn bearish.
Keep in mind that this trade might not be a long-term option as the overall trend for ZB is still bearish. It could be a way to make a quick swing, but price may end up pushing toward 125.
There is also bullish pressure coming through on the RSI adding more fuel to the potential high expectancy long trade mentioned above.
