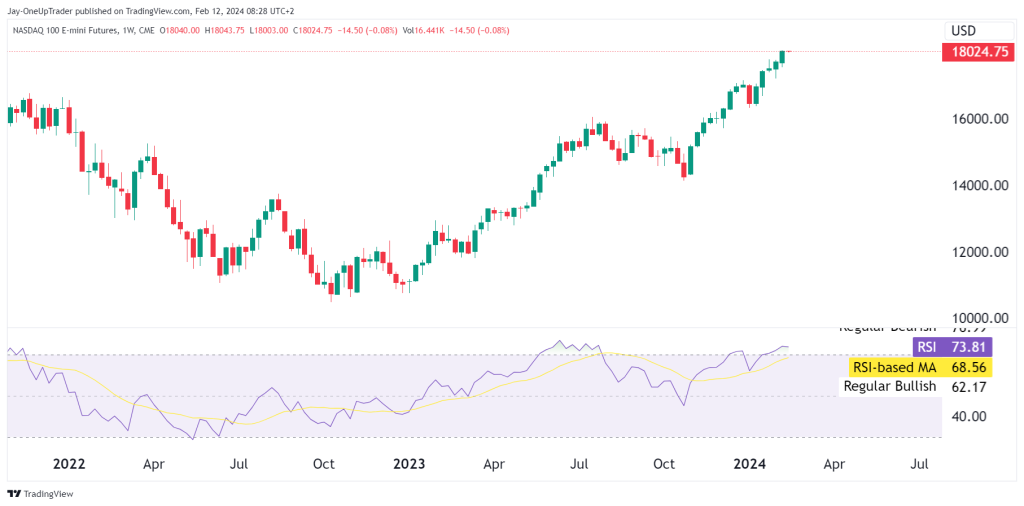
Weekly Timeframe Analysis:
On the weekly chart, we can see price has been in a solid uptrend since the beginning of the year. The Relative Strength Index is currently in overbought territory. Despite the overbought RSI, we should consider the prevailing uptrend as the dominant force until price action suggests otherwise.
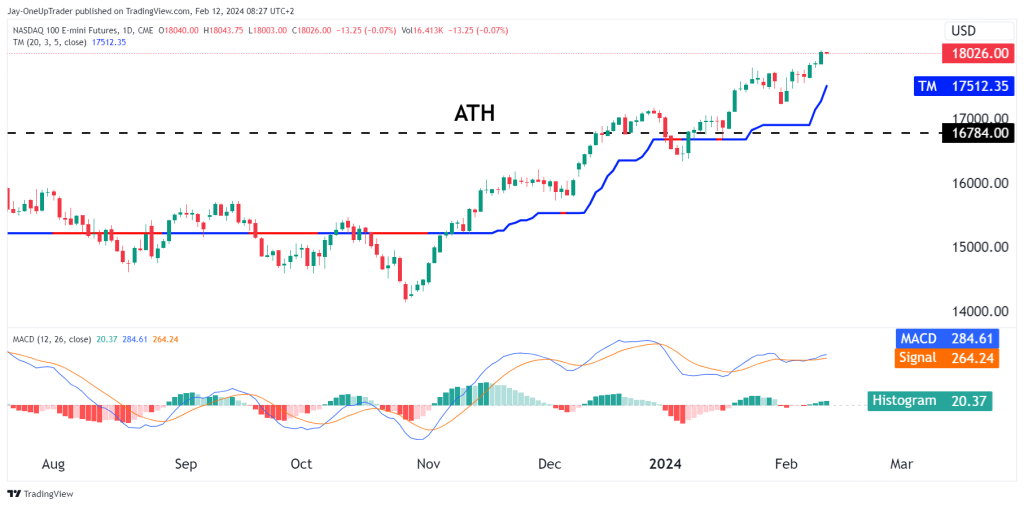
Daily Timeframe Analysis:
The daily chart reveals a sustained uptrend, with the MACD currently positioned above the signal line, indicating continued bullish momentum. The price is trading above the trend-following moving average, reinforcing the bullish sentiment.
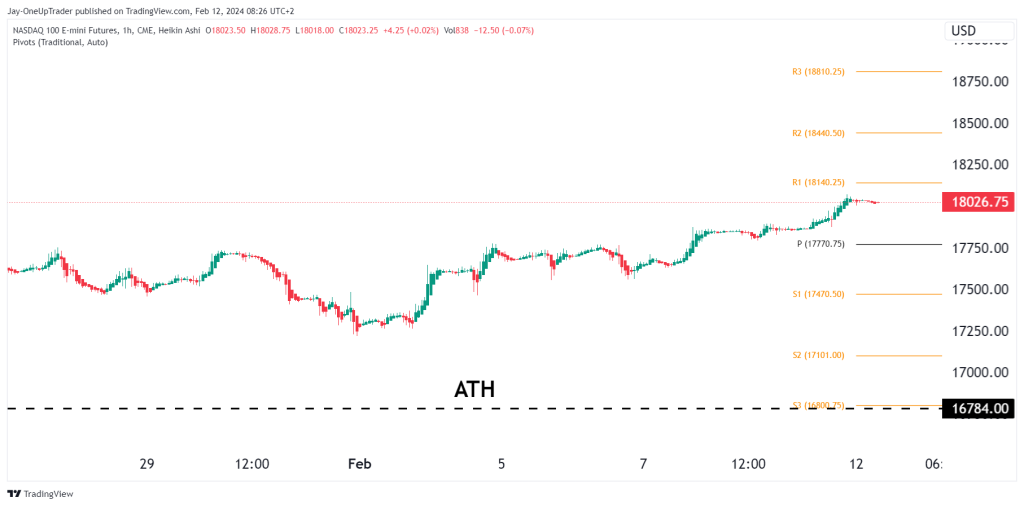
1-Hour Timeframe Analysis:
The price is hovering around the R1 pivot point at 18140.25, serving as immediate resistance. A decisive hourly close above this level could indicate that the bulls have enough strength to push the price higher, targeting the R2 at 18440.50, and possibly the R3 at 18810.25 in the event of continued upward momentum. Conversely, should the price retreat, the pivot point (P) at 17770.75 stands as short-term support, with a further drop potentially challenging the S1 at 17470.50, and if bearish pressure mounts, we could see a move towards the S2 at 17101.00.
Trade Considerations:
- Long Position: A strong break above the R1 on the hourly chart could warrant a long position, aiming for R2 and R3 with a stop loss just below the pivot point (P).
- Short Position: Should there be a failure to pass R1 accompanied by reversal signals, a short trade could be considered, targeting the pivot point and potentially S1, with a stop loss set above the R1 resistance.
Rating and Conclusion:
The analysis from the weekly to the hourly timeframe presents a Bullish outlook for the NASDAQ 100 E-mini Futures. The indicators are predominantly positive, with the daily MACD above the signal line and the price maintaining its position above the trend-following moving average. Despite the RSI suggesting an overbought market on the weekly chart, the strong trend encourages a bullish perspective. We should trade with confidence in the bullish trend while remaining vigilant for signs of reversal. Risk management is crucial, as is the flexibility to adapt to changing market conditions.