

Given the RSI readings showing oversold conditions on the 4-hour chart but not yet confirmed on the daily chart, traders should be cautious and confirm with additional indicators or price action before entering trades. The NASDAQ 100 is volatile, and news or economic events can have immediate impacts, so keeping abreast of such factors is crucial. Remember, discipline and risk management are key, so ensure that your trade size is appropriate for your account and that you have clear stop-losses and take-profit levels set.
Trade Opportunities
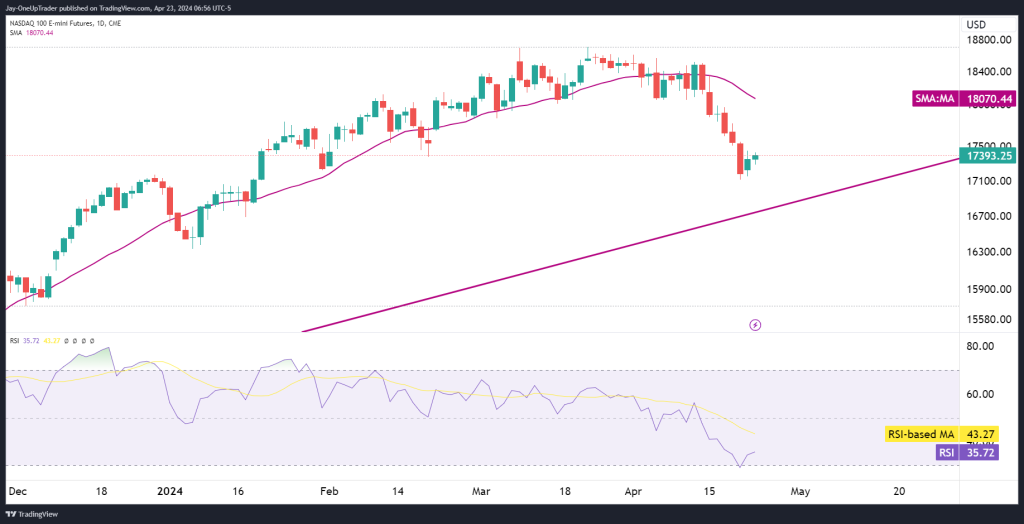
Short-Term Long Position: If there’s a bounce from the current levels near the major trendline on the daily chart, traders could consider a long position. Look for signs of price stabilization and a reversal candlestick pattern as a confirmation for entry.
- Entry Point: Near the trendline support around 17,393.25.
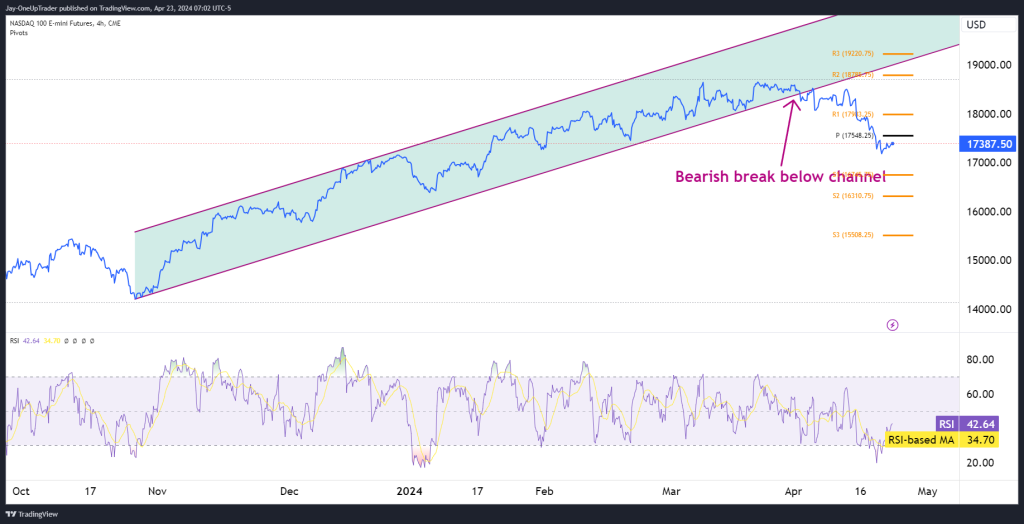
- Profit Target: The first target could be the 21-SMA at 18,070.44. Upon a strong bullish reversal, the next target could be the pivot level (P) at 17,854.25 on the 4-hour chart.
- Stop-Loss: A break below the trendline support, around 17,300, could be used as a stop-loss indicator.
Bearish Continuation Trade: If the price continues to decline and breaks below the trendline and the RSI remains weak, traders may look for a bearish continuation trade.
- Entry Point: A clear break and close below the trendline support.
- Profit Target: The subsequent support levels to watch are S1 (16,310.75) and S2 (15,508.25) on the 4-hour chart for longer-term bearish targets.
- Stop-Loss: Set above the trendline or a recent swing high to minimize risk, possibly around 17,500.
Levels to Watch:
- Immediate Support: Trendline support near 17,393.25.
- Secondary Support: S1 at 16,310.75 and S2 at 15,508.25 for more extended moves to the downside.
- Resistance: The 21-SMA at 18,070.44 on the daily chart and the pivot point at 17,854.25 on the 4-hour chart.
Important Note On Risk Management
Risk management and discipline are essential elements of successful trading. Traders need to understand this deeply if they wish to be successful in financial markets. Do you really understand the importance of risk management?