


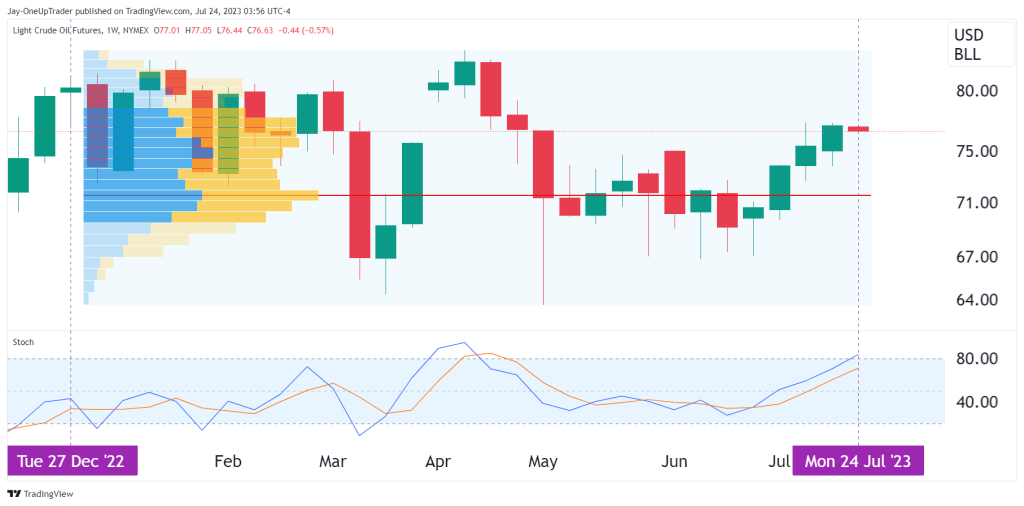
- Point of Control is sitting at $72 on the weekly chart.
- Stochastic indicator is approaching overbought.
- Four consecutive green weekly candles signal high buying pressure, leading us to consider if the long trade opportunity is over.
Weekly chart
Volume profile: The point of control for the volume profile, if we measure from the first trading day of the year up until now, is $72. This is the price at which the entire year had the most trading volume. It is likely to act as a magnet for price as it has the most liquidity there. We cannot be sure that there will be support at that level, but the market, in general, is attracted to the point of control line.
Stochastics: Since we are in a range-bound environment in CL, we can apply a stochastic to monitor when the price enters overbought or oversold. the %K level is already overbought and %D is not far behind.
Candlesticks: There are four green weekly candles in a row now, signaling that buying pressure has been high. Traders may feel that they have missed the opportunity to go long now, though.
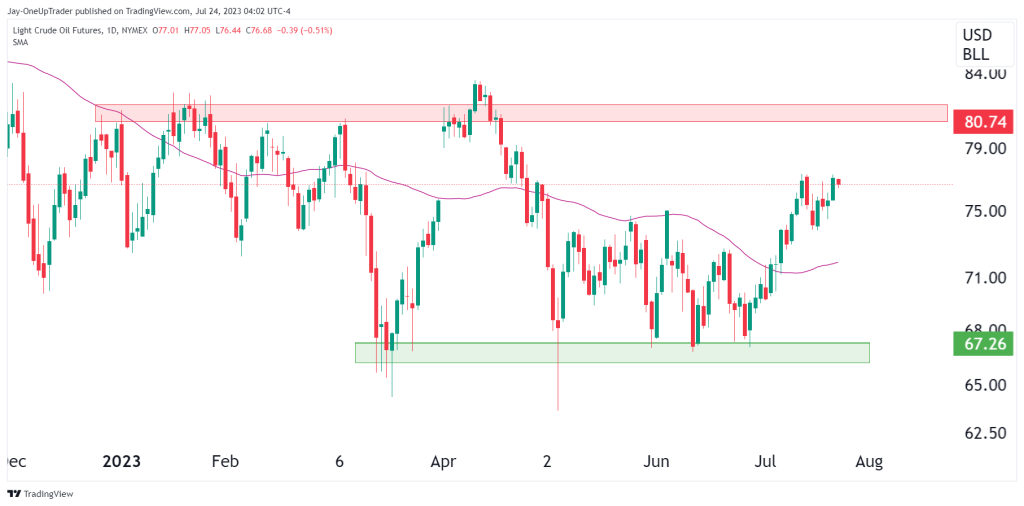
Daily Chart
There is a resistance zone at $80.74 and a support zone at $67.26. It is difficult to say which level will be tested first, but all we can do here is think in probabilities and concentrate on maintaining solid risk management rules. Most importantly, we can consider if there is an actual trade opportunity available that gives us a good expectancy and risk-reward ratio. At the moment, I don’t see any when it comes to looking at the daily chart because price is currently sitting in ‘no man’s land.’ If we see a retracement to around the 50 MA at $72, then we could jump down to a shorter time frame and look for reversals in the form of candlestick patterns.
