

Introduction
The recovery we looked at in our 4 November analysis did not hold. We were watching for bulls to reclaim 28,800, but sellers have since pushed NQ below the moving averages and the July low area near 27,200.
Today’s session is showing another attempt to reverse, with price recovering from 26,366.50 to around 27,204, up roughly 2.26% on the day at the time of the chart. What makes this bounce worth watching is where it is happening: NQ is testing a rising trendline that stretches back to April 2025.
Let’s take a closer look at the weekly and daily charts and what needs to happen for buyers to hold this level.
Can the weekly trendline hold?
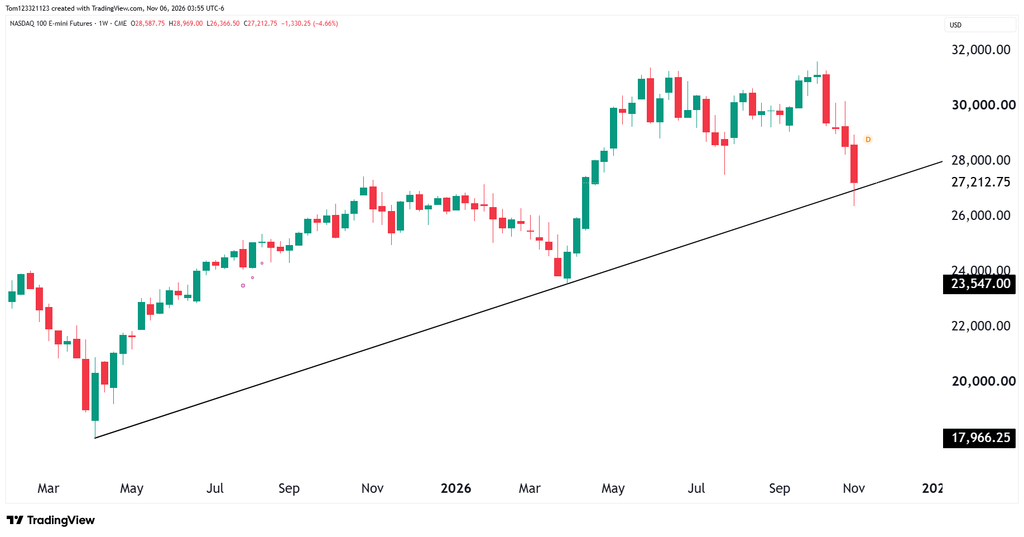
The most important feature on the weekly chart is the ascending trendline connecting the April 2025 low at 17,966.25 with the April 2026 low at 23,547. That line now runs through roughly 26,900–27,000.
Price has already traded below it yesterday (5 November) as NQ fell over 7% in a massive drop. This gives bulls something to work with, although the weekly candle is still open with today’s session (6 Novemeber) likely going to be a small recovery.
Next week will be important for bulls, if the trend line doesnt hold, we could see a drop tp $21,000 on NQ.
NQ daily technical analysis
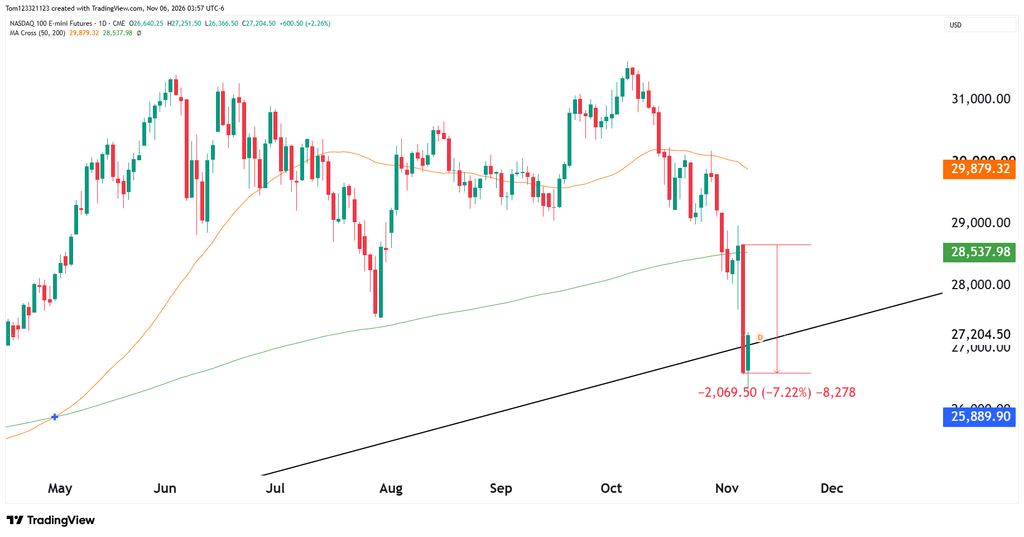
The daily chart still favors the bears. Yesterday’s large red candle pushed price decisively below the 200-day moving average at 28,538, while the 50-day moving average at 29,879 is turning lower.
Today’s bounce has recovered part of that drop, but buyers still have several levels to overcome. 28,000 is the first round-number hurdle, followed by the 28,500–28,800 area, where the 200-day moving average sits close to the previous support zone.
For now, this is a recovery from long-term support within a falling daily market. Holding the trendline would improve the chance of a bounce continuing, but reclaiming those overhead levels would provide stronger evidence that the selling is easing.
Possible NQ trades
Long trade: For traders looking for the trendline to hold, an hourly higher low followed by a break above the preceding swing high could provide a setup. Stops can sit below that higher low, with potential targets at 28,000 and then 28,500–28,800. A renewed move below the trendline would weaken the setup, while a break below 26,366.50 would invalidate the recovery from today’s low.
Short trade: For traders treating this as a retracement, watch for an hourly reversal if price reaches 28,000 or the 28,500–28,800 resistance area. Stops can sit above the reversal high, with targets back toward the rising trendline and, if it breaks, 26,366.50.
Disclaimer: Educational content only; no personalized investment recommendation is intended. Futures carry substantial loss risk. Examples are hypothetical, and stop orders cannot guarantee an execution price.