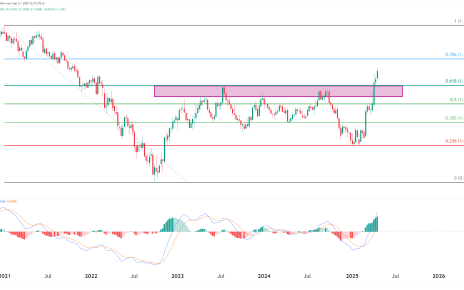
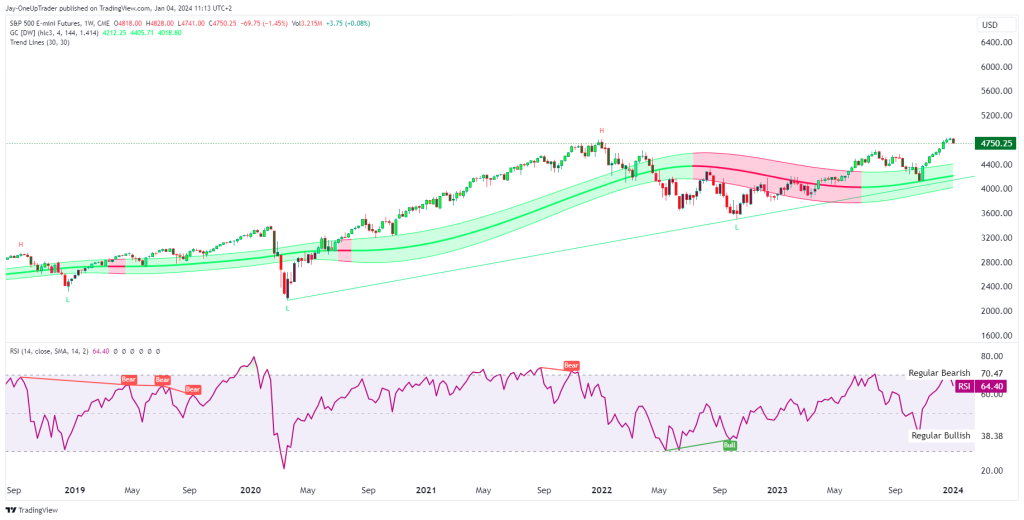
Weekly Chart Analysis:
The price is currently above the Gaussian channel, showing a bullish trend over the long term. However, we should note that there are all-time highs (H) that could act as resistance. The RSI is at 64.40, indicating that the market is neither overbought nor oversold, giving us room for potential price movement in either direction. The RSI almost hit overbought territory but has quickly retraced from there once price tested the all time high.
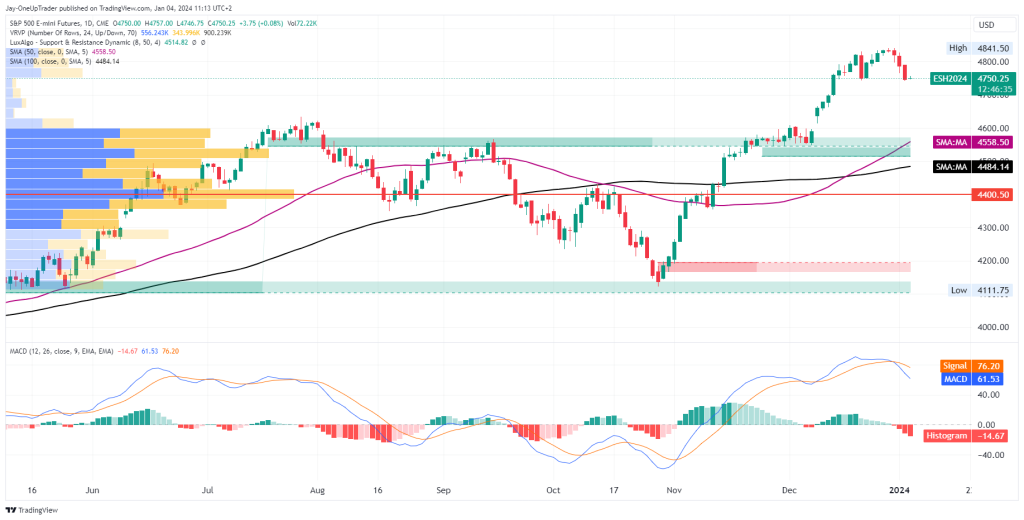
Daily Chart Analysis:
The price has traded above the 50-day SMA (4558.50) and the 100-day SMA (4484.14) since November last year. However, the MACD histogram shows a decrease in bullish momentum as it’s moving below the signal line. This normally means a slowing down of the upward trend or a potential reversal. The first major support is around the $4558.50 level.
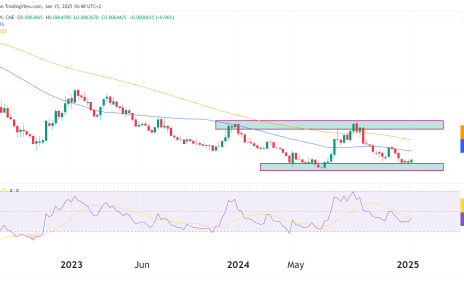
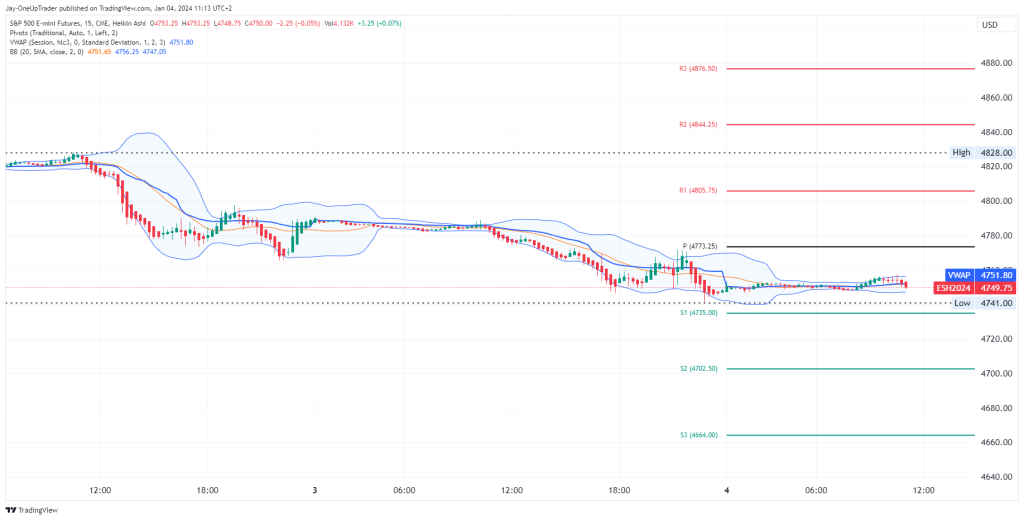
15-Minute Chart Analysis:
We can see that the price is fluctuating around the VWAP (Volume Weighted Average Price), indicating a neutral short-term sentiment. The Bollinger Bands are relatively tight, which often precedes a period of increased volatility. We should watch for a breakout from the Bollinger Bands for directional clues and use the pivot point indicator to set our targets.
Trading Strategies:
- Bullish Scenario:
- Trade: Consider a long position if the price remains above the 50-day and 100-day SMAs on the daily chart and looks to be setting higher lows.
- Target Levels: Look to take profits near the previous highs on the weekly chart.
- Stop-Loss: Set below the most recent swing low on the daily chart to mitigate risk.
- Bearish Reversal Trade:
- Trade: If you see a confirmed break below the 50-day SMA on the daily chart with increasing volume, consider a short position.
- Target Levels: First target could be the 100-day SMA, followed by lower pivot levels on the 15-minute chart.
- Stop-Loss: Place above the 50-day SMA to protect against a false breakout.
While the long-term trend appears bullish, the daily indicators provide a mixed signal, and the intraday setup suggests that a volatility expansion could be near. We should be prepared for both trend continuation and potential short-term pullbacks. Trade entries should be aligned with the broader trend unless there are clear signals of a reversal. Monitoring the MACD on the daily chart will be crucial in the upcoming sessions to gauge the momentum. As always, maintaining a solid risk-reward ratio and adhering to stop-loss levels are critical to protecting the capital.