


Introduction
Last time we looked at Crude Oil was on the 22nd of October. The ascending triangle we looked at then is still the most prominent feature on the chart. CL rallied for two weeks after the analysis we did to test the resistance at 105.10, and the selling was strong enough to send price dropping again, now close to testing the 50-period moving average.
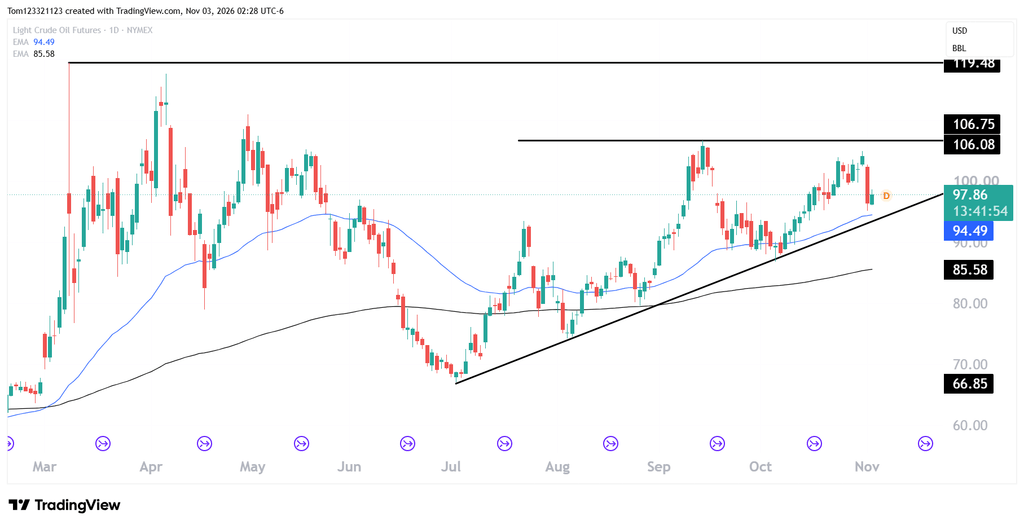
CL did drop 7.3% on the 2nd of November, though, as hopes grew for a diplomatic breakthrough between the United States and Iran, easing concerns about potential supply disruptions in the Middle East. Reports that Washington was willing to pursue talks helped push U.S. crude futures down about 7.5%.
As we have seen, however, these developments have proven to be short-lived and only a short-term reaction. With the price sitting close to the 50 ema and the ascending trend line, it could be a long opportunity.
CL Possible Trades
Long trade: Looking for reversals on the hourly chart like a inverse head and shoulders or a double bottom etc could be the way to go for bulls. As long as price remains above the 50-period moving average or finds support there, and importantly, above the ascending trend line. A break below that would invalidate the long setup.
As always, trade with caution on Oil because it is in a very volatile period now with the developments in the Middle East.
Disclaimer: Educational content only; no personalized investment or trading recommendation is intended. Futures carry substantial loss risk and may be unsuitable for some traders. Examples are hypothetical and do not predict results. Stop orders cannot guarantee an execution price. Evaluation requirements and payout terms vary and may change; consult the provider’s current rules.