

Introduction
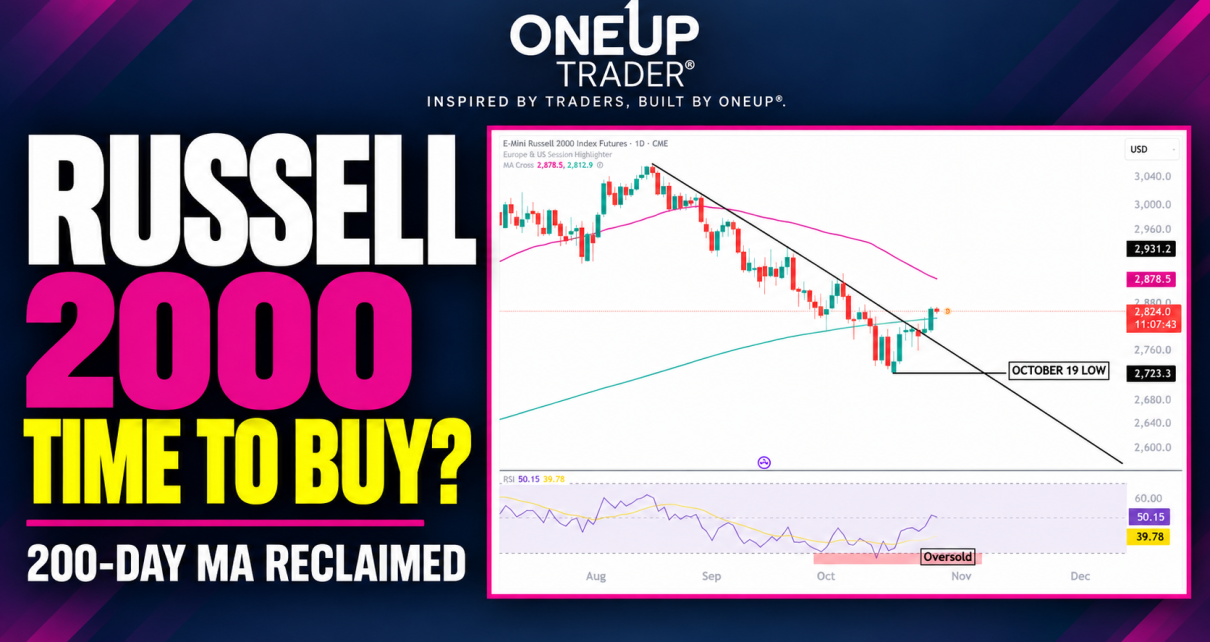
The Russell 2000 has still been underperforming its big brothers, but there might be a reversal just on the horizon for the small caps. RTY dropped 12% from its peak made on the 17th of August and, after trading below the 200-day moving average for a few sessions, is now back above it, so let’s take a closer look at the technicals and if there are any possible trades that we can take right now.
Is the Russell a buy?
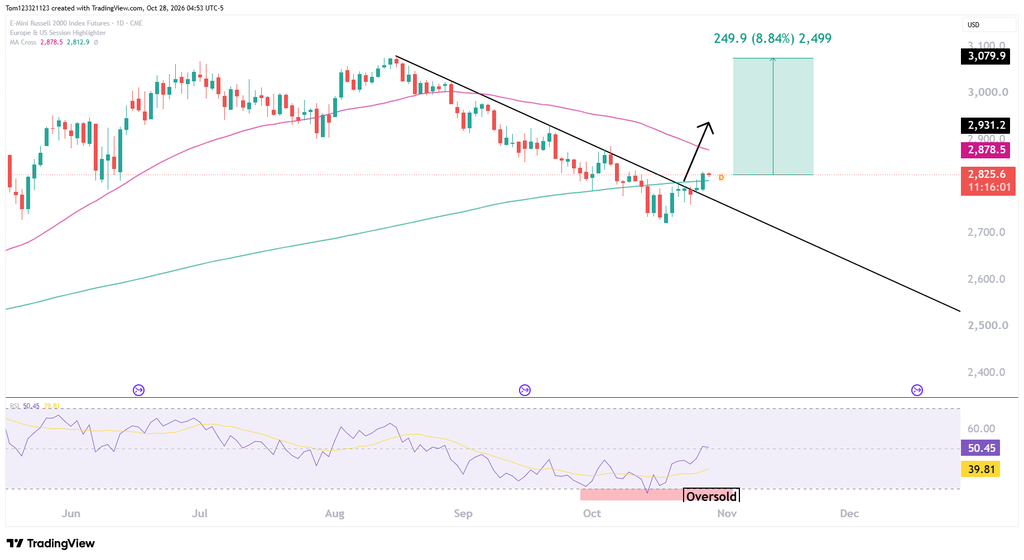
Technical analysis is showing more bullish signals now than bearish ones; as we already mentioned, RTY is trading above the 200-day moving average and has also broken above the descending trendline that we drew from the August high peak. The close we saw from yesterday’s session (27 October) was a positive one too, with a full green-body candle.
The RSI is also recovering from being oversold and is now trading at 50 again.
Where is the Russell going to go?
RTY could head higher as long as price remains above the 200-day moving average and, more importantly, the low made on October 19th.
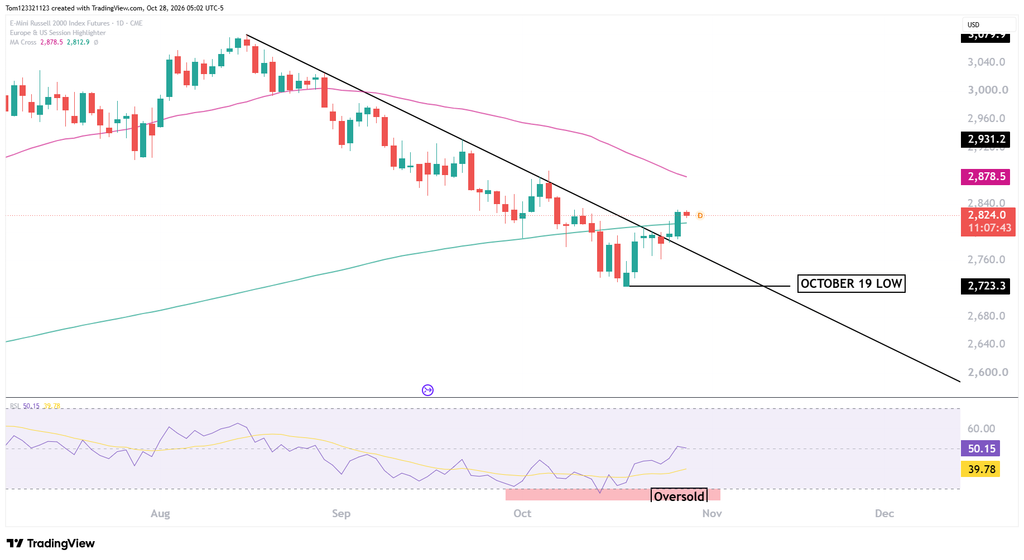
Support and resistance levels for RTY
| Support | Resistance |
| 2,723-2,7250 | 2,905 |
| 50-day MA | |
| 3,080 |
Possible trades
Long trade: Accumulating buys from current levels (2,826) and in the support zone we marked in the table above, with stops below the low of 2,723.
Short trade: Short trades could be taken now if there are signs on a shorter time frame that the recovery is stalling. Stops can be placed on the most recent significant high (recommended hourly chart) with targets at the descending trend line and as price moves into the support zone.
This analysis is for educational and informational purposes only and does not constitute trading advice or a recommendation to buy or sell any futures contracts. Futures trading involves significant risk and may not be suitable for all investors. Always conduct your own research and consult with a licensed financial professional before making trading decisions.