


reading time: 3 min
Introduction
Is the low in for wheat futures and is this a strong buying opportunity?
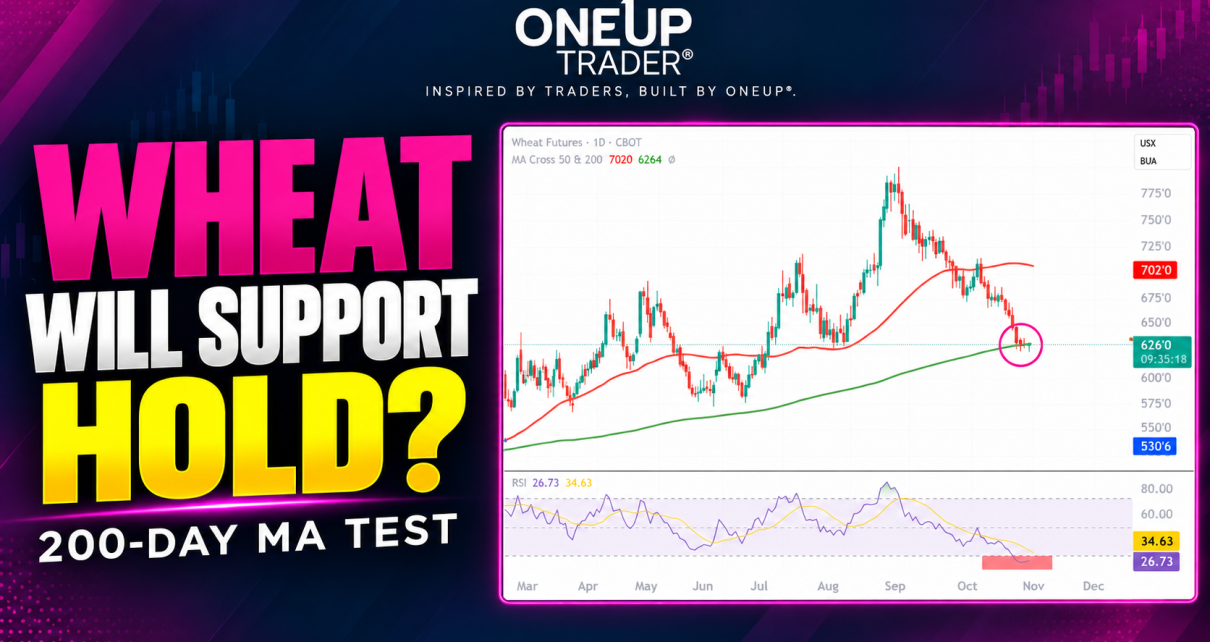
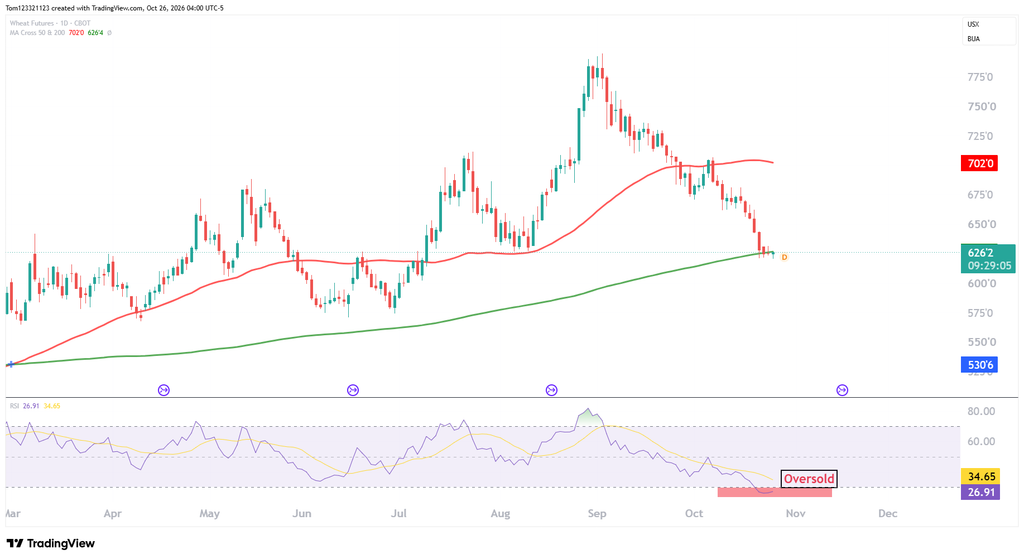
Wheat futures are testing an important support area after extending their decline from the late-summer highs. Price is trading around 626.0, close to the 200-day moving average. With the daily RSI below 30, this could the the time we see a reversal.
The short-term trend remains bearish, however. Holding support would be the first step toward a rebound; buyers still need to break the sequence of lower highs before the outlook improves.
Daily Chart: Wheat Tests Long-Term Support
We have seen wheat prices fall because recent fundamentals have put pressure on them. Black Sea peace-talk announcements have raised hopes of smoother grain shipments, encouraging traders to reduce the premium associated with supply disruptions. Rainfall across the U.S. Plains has also improved conditions for winter wheat establishment. Meanwhile, USDA lowered its U.S. wheat export forecast and raised expected domestic ending stocks, reflecting weaker overseas demand. These developments help explain the recent selling, although projected U.S. stocks remain below last year’s level, leaving prices sensitive to renewed supply concerns.
RSI Is Oversold, but Confirmation Is Missing
The daily RSI is around 26.73, reflecting the strength of the recent selling. Although momentum appears to be stabilizing slightly, there is no clear confirmation that buyers have regained control.
Key Levels
| Price area | Role | Why it matters |
|---|---|---|
| 700–705 | Major resistance | 50-day moving average and previous rejection area |
| 670–680 | Resistance | October consolidation and lower-high region |
| 650–660 | Initial resistance | Recent breakdown area and first rebound hurdle |
| 620–630 | Immediate support | Rising 200-day average and previous price base |
| 600 | Lower support | Round number and earlier trading area |
| 575–585 | Deeper support | June and early-July base |
Possible Trades
Bullish scenario: If wheat holds 620–630, traders could watch the hourly chart for a higher low followed by a break above the local rebound high. That would provide more useful confirmation than buying solely because RSI is oversold. Initial upside areas are 650–660 and then 670–680. Any entry should leave enough room to the first resistance area to justify the risk below the setup’s swing low.
Bearish scenario: A daily close below 620, followed by a failed attempt to reclaim the support zone, would favor further downside toward 600. If that level also fails, 575–585 becomes the next area to watch.
This analysis is for educational and informational purposes only and does not constitute trading advice or a recommendation to buy or sell any futures contracts. Futures trading involves significant risk and may not be suitable for all investors. Always conduct your own research and consult with a licensed financial professional before making trading decisions.