

estimated reading time: 4 min
Introduction
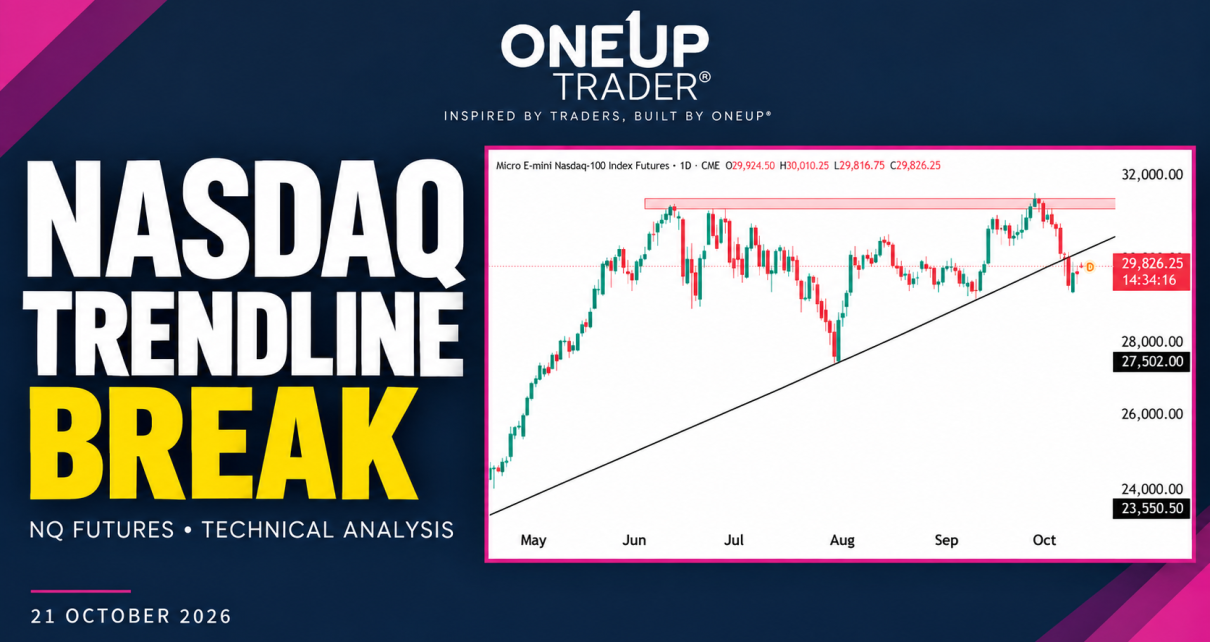
Nasdaq futures have slipped beneath the bullish trendline that started in April, following another rejection near 31,200–31,500. Price is trading around 29,826, leaving buyers with an important recovery task: they need to push back above 30,000.
Bulls need to reclaim that trend line to improve the outlook, while another rejection would strengthen the case for a move back toward the 29,200 and possibly lower to 27,500.
Nasdaq Futures Trend Analysis
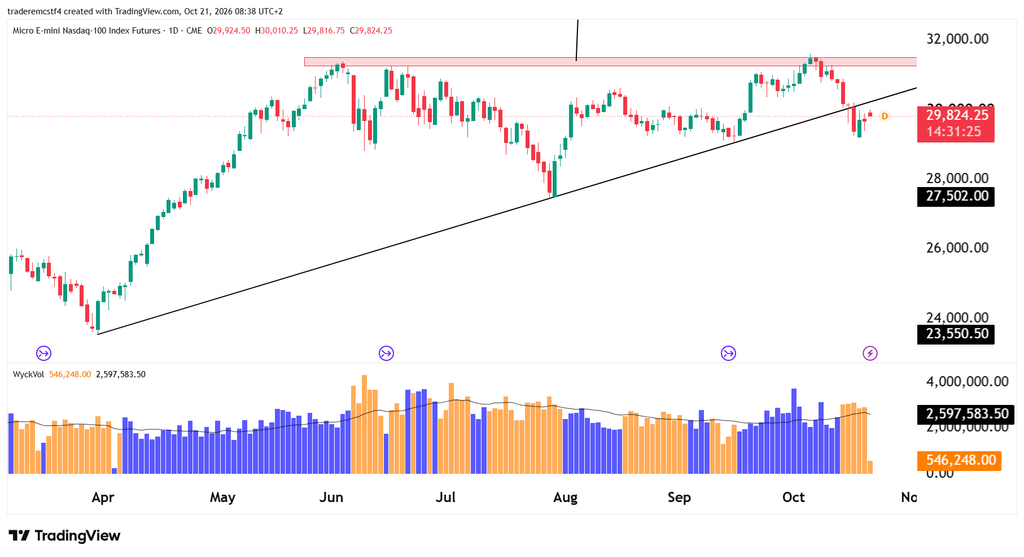
The rally from the April low at 23,550.50 established a strong upward trend. After the summer correction, buyers defended 27,502 in late July and eventually pushed the market back toward its June highs. If we take a more zoomed-out look at the chart, NQ has not really moved since the beginning of June. It has been trading in a range mainly between 28,800 – 31,400. This means that when we do see a breakout, it should be a strong one, and that even though the bullish trendline has broken, it still has an overall feel that eventually we get a bullish break above the ATH as long as there is no massive escalation in the Middle East or Russia and Ukraine.
What Is Volume Showing?
Several of the recent declining sessions recorded higher volume than much of the September consolidation. That adds weight to the selloff and makes the trendline break worth watching closely.
The latest session is still underway, so its small volume bar cannot yet be compared fairly with completed daily bars. The more useful signal will be whether a recovery attracts stronger participation and closes back above resistance.
Key Levels
| Price area | Role | What to watch |
|---|---|---|
| 31,200–31,500 | Major resistance | June and October peak area |
| 30,500–30,800 | Secondary resistance | Previous October trading area and a potential recovery target. |
| 30,000–30,300 | Immediate recovery hurdle | Round-number resistance and the approximate broken-trendline area. |
| 29,000–29,300 | Near-term support | Recent October lows and the September base. |
| 28,000 | Lower reference level | Round number ahead of the more important July low. |
| 27,502 | Major structural support | July swing low supporting the broader recovery. |
Possible Trades
Bullish recovery: Buyers would want a daily close back above the trendline, followed by a successful hold of the 30,000–30,300 area. That would mean the breakdown is losing momentum and bring 30,500–30,800 into focus. A return to the major highs would become more credible only after that resistance clears.
Traders looking for an earlier long entry could monitor the hourly chart for a higher low and a break above a local swing high. Until the daily trendline is recovered.
Bearish continuation: A rally into the broken trendline that forms a lower high would favour another test of 29,000–29,300. A daily close below that support, followed by a failed recovery, would expose lower levels toward 28,000 and potentially 27,502.
For either setup, the stop should sit beyond the swing that invalidates the entry, with enough distance to the first target to justify the risk.
The immediate bias remains cautious while price trades beneath the trendline. Reclaiming 30,000 is the first step for bulls; holding above the broken trendline is the more meaningful test.
This analysis is for educational and informational purposes only and does not constitute trading advice or a recommendation to buy or sell any futures contracts. Futures trading involves significant risk and may not be suitable for all investors. Always conduct your own research and consult with a licensed financial professional before making trading decisions.