Reading time: 3 minutes
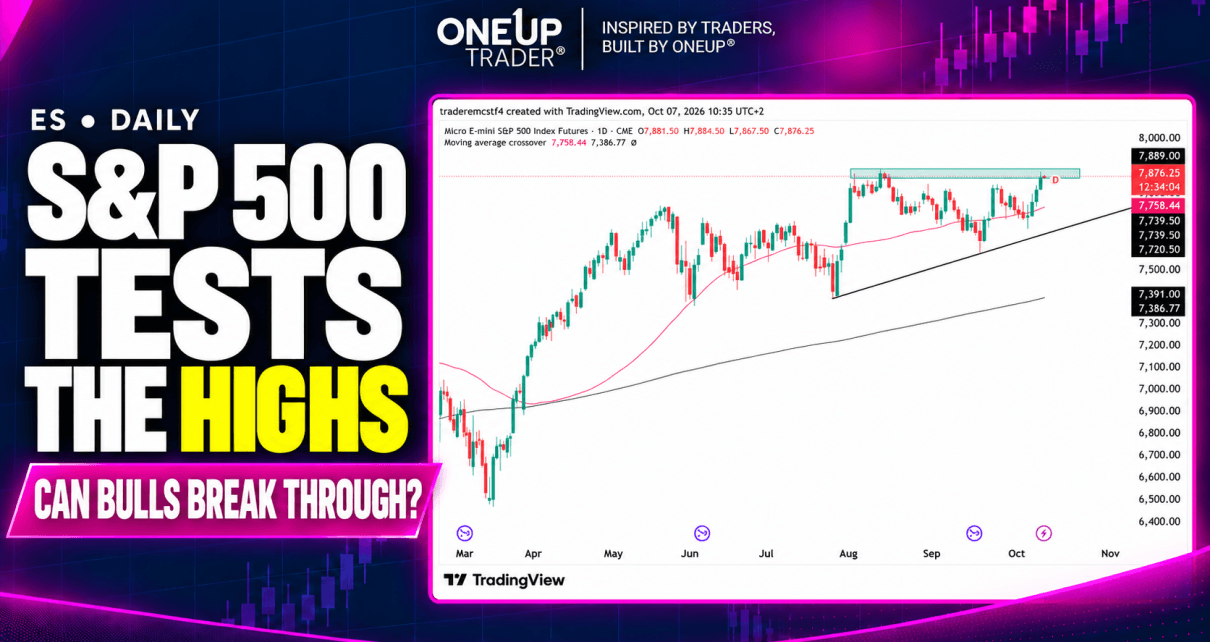
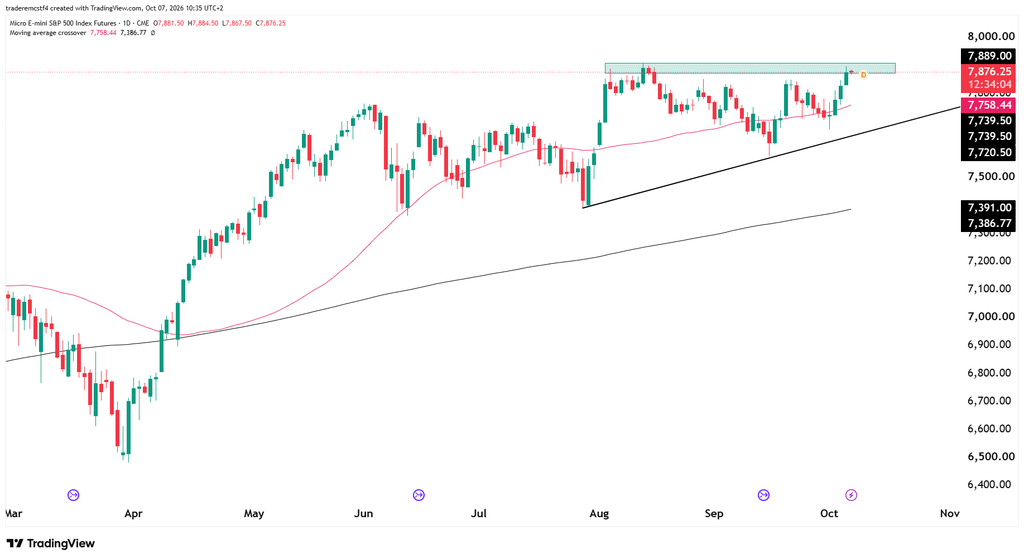
The S&P 500 is testing the all-time high once more, and now the bulls need to follow through and push the price above 7,906.
The trend is bullish. There is not much to look at in the chart, but let’s see what important levels are to note and if there are any possible trades.
| Level | Importance |
|---|---|
| 8,000 | Psychological upside reference after a confirmed breakout |
| 7,870–7,910 | Highlighted high zone and immediate breakout test |
| 7,800–7,830 | Nearby trading area to watch on an initial pullback |
| 7,750–7,760 | Rising pink moving average, currently 7,758.30 |
| 7,720–7,740 | Recent consolidation area beneath the average |
| 7,600–7,650 | Approximate rising trendline area at the current date |
| 7,385–7,395 | Longer moving average and late July swing-low area |
What matters now is how price behaves at the ceiling. A brief move above the previous high followed by a close back inside the range would leave the risk of a false breakout and shorts could flood in. A stronger development would be a daily close above the entire resistance zone, followed by continued buying or a pullback that holds the former ceiling as support.
A successful break would put 8,000 in focus.
There are three useful scenarios to watch:
- Bulls clear the highs. A close above 7,906, followed by price holding above the breakout area, would support continuation toward 8,000. The first pullback would help show whether buyers are prepared to defend the higher prices.
- Price pauses beneath resistance. Several smaller candles holding near the highs could allow the market to consolidate before another attempt. A pause alone would not damage the bullish structure, particularly if pullbacks remain shallow and hold above 7,800.
- The attempt fails. A rejection followed by a loss of 7,800 would raise the likelihood of a return toward the moving average near 7,758. Sustained weakness through 7,720–7,740 would make the latest recovery less convincing and bring the rising trendline into focus.
This analysis is for educational and informational purposes only and does not constitute trading advice or a recommendation to buy or sell any futures contracts. Futures trading involves significant risk and may not be suitable for all investors. Always conduct your own research and consult with a licensed financial professional before making trading decisions.