Introduction
In our September 15 analysis, we were watching for another push higher after crude’s strong rally. That continuation has not followed through, and after a week of trading, price is back in the low 90’s. We now focus on whether buyers can hold this level or if we see a further drop to the mid or low 80’s.
Daily Chart
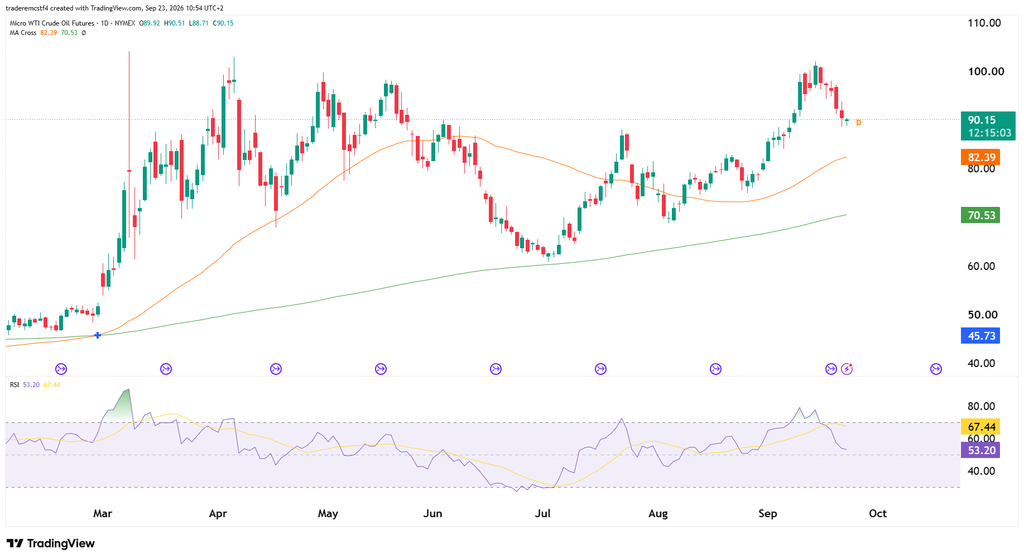
The daily chart was overbought significantly so the pullback we have seen is warranted. This retracement is a healthy one for momentum if we see bulls re-enter the market and push back to the recent highs from mid-September.
The first area to watch is $89–$90, followed by stronger support around $86–$88. If buyers cannot defend that zone, the rising moving average near $82.40 becomes the next meaningful reference.
For the bulls, reclaiming $92–$93 would be an initial sign that selling pressure is easing. A successful retest could open a recovery toward $95–$97, with $100–$102 remaining the larger resistance area. Today’s small green candle alone is not enough to confirm a reversal, particularly before the daily close.
Possible Trades
| Setup | Entry condition | Stop | Targets |
|---|---|---|---|
| Short a failed bounce | Rejection around $92–$93, followed by a lower high on the hourly chart | Above $94 and the rejection high | $88, then $84 |
| Long a support bounce | Bullish reversal within $86–$88, followed by an hourly higher low | Below $85 and the reversal low | $92, then $95 |
This analysis is for educational and informational purposes only and does not constitute trading advice or a recommendation to buy or sell any futures contracts. Futures trading involves significant risk and may not be suitable for all investors. Always conduct your own research and consult with a licensed financial professional before making trading decisions.