- Could this be the last call for the bears as price rallies?
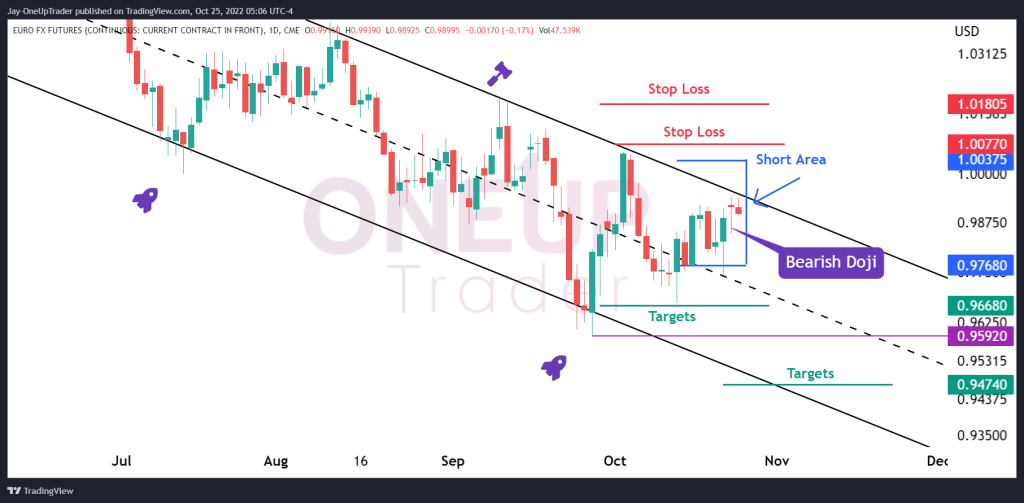
- Bearish Doji Pattern forms on the Daily chart.
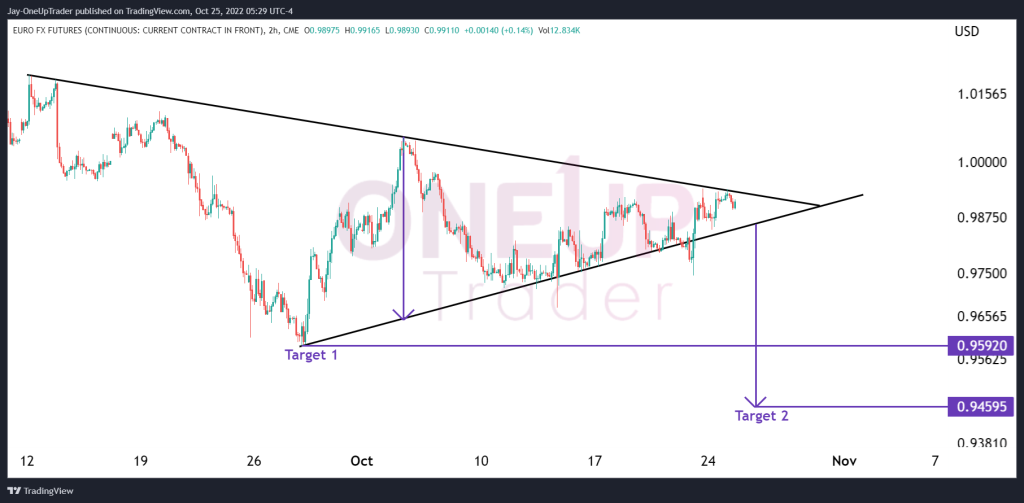
- Symmetrical Triangle Formation On 4-Hourly chart.
Short Opportunities With Very Low Risk
Before we take a look at the developments in the Euro and what to expect moving forward, read over the previous article as each one follows the other while we analyze the markets from week to week. You can view the article here.
The price has rallied up to the top side of the downward channel forming a bearish Doji for yesterday’s session. This may be the last call for bears to short the Euro as a break above the upper trend channel line would signal a potential consolidation period, followed by a bullish trend reversal. Traders must exercise caution, though, as the ECB rate decision and US GDP reports on October 27 could cause extreme price volatility in the market.
The risk could be slightly adjusted but not a necessity, so we have marked off two points where stop losses could be placed. Targets remain the same from last week’s analysis, with an additional target at $0.947, but this can only be possible if we see the first target hit.
Ascending Triangle Formation With Expectation Of Bearish Break
The symmetrical triangle is a reliable chart formation, traded as a trend continuation pattern. Since we have a downtrend before this formation, we expect a bearish break out shortly. If we see the Bearish break, the conservative target 1 would be the low of the pattern at $0.959, and target 2, which is a full extension of the converging ends, will be at $0.945. Please remember that these targets are only relative if we see the bearish break. Often symmetrical triangles can consolidate out of the pattern and move sideways for a while.