Introduction
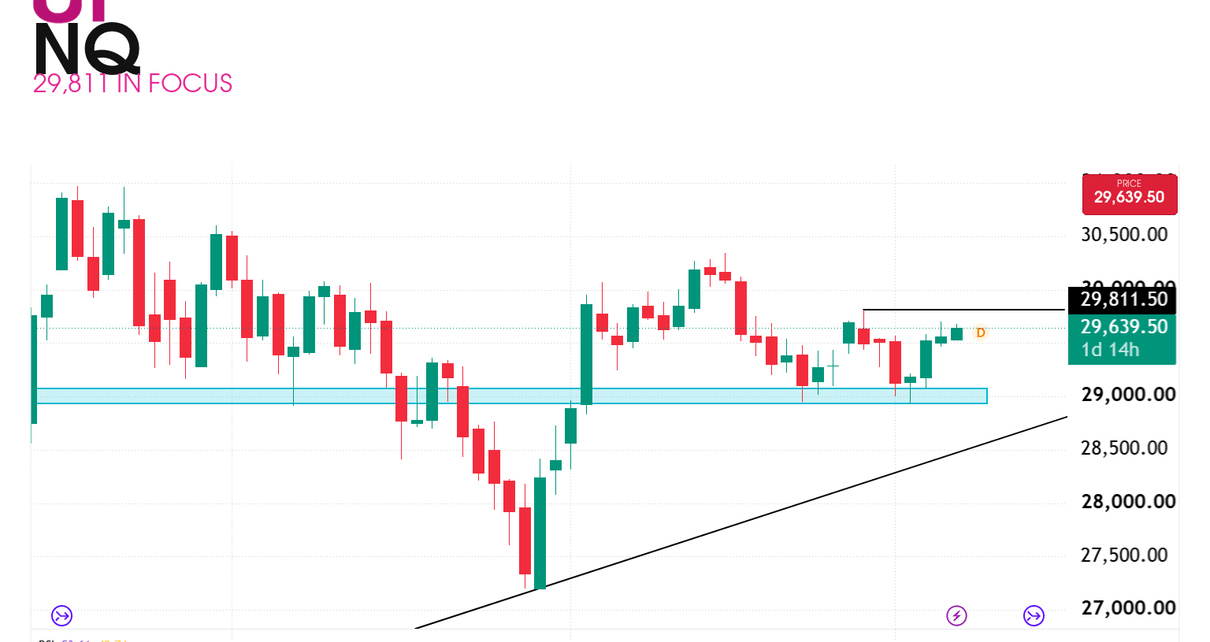
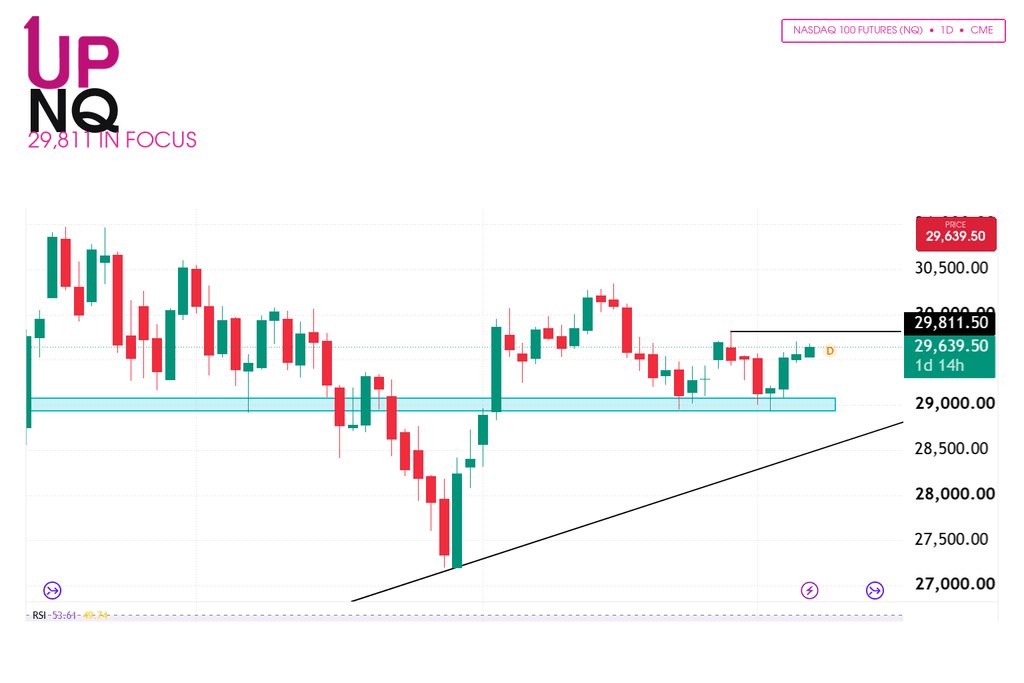
This is a follow-up to the 3 September analysis, where NQ was sitting on the 29,000 support zone with a morning star on the daily chart. That bounce has held. The morning star formed on the Wednesday session and confirmed on the Thursday green day, and that Wednesday close was 1.16% up. On the 7 September session price is 29,639.50. The level bulls still have to clear is 29,811.50 for there to be confirmation that the buying power is there.
If they’re able to break above 29,811.50, the next target is around 30,200. If they can clear that as well, then we start looking at the all-time high at 31,100.50. If they can’t clear that first hurdle, we’re likely to see price go back down to test 29,000, and from there it may break lower. Until that is decided, 29,000 / 29,811.50 / 30,200 is the map.
Nasdaq Futures Trend Analysis
The 29,000 area is the support zone on the chart. The bounce off that floor was strong, and it came with the morning star on Wednesday and the confirmation on Thursday. That’s what’s carried price into the mid-29,600s.
What we need to see from here is for price to clear above 29,811.50. If we get that break, the next target is around 30,200. If bulls can clear 30,200 as well, the all-time high at 31,100.50 comes into play. If they cannot, the 29,000 support stays in play, and a break lower from there is still on the table.
We are not chasing through 29,811.50 just to force the higher targets. Let the close choose the next move.
Key Levels
| Level | Notes |
|---|---|
| 31,100.50 | All-time high. Comes into play if bulls clear 30,200. |
| ~30,200 | Next target if NQ breaks above 29,811.50. |
| 29,811.50 | First hurdle for the bulls. Still open from the 3 Sep note. |
| 29,639.50 | 7 September session price. |
| 29,000 | Support zone. Bounce and morning-star base; retest risk if 29,811.50 fails. |
Possible Trades
Primary setup: Bullish continuation
- Entry trigger: daily close above 29,811.50
- Stop: below 29,000
- Target: around 30,200 (then 31,100.50 if that clears)
Scenario 2: Breakdown (alternate)
- Entry trigger: daily close below 29,000
- Stop: above 29,811.50
- Target: morning-star bounce cancelled (no lower print in this packet)
Scenario 3: Range / do not chase (alternate)
If NQ holds between 29,000 and 29,811.50, we stay out of the middle. The bounce from support is already in. Chasing into the first hurdle is the trade we do not take. Let the close choose 29,811.50 or 29,000.
This analysis is for educational and informational purposes only and does not constitute trading advice or a recommendation to buy or sell any futures contracts. Futures trading involves significant risk and may not be suitable for all investors. Always conduct your own research and consult with a licensed financial professional before making trading decisions. The Primary setup above is a TradingView simulation track, not a live account signal.
Hypothetical or simulated performance results have certain limitations. Unlike an actual performance record, simulated results do not represent actual trading. Also, since the trades have not been executed, the results may have under- or over-compensated for the impact, if any, of certain market factors, such as lack of liquidity. Simulated trading programs in general are also subject to the fact that they are designed with the benefit of hindsight. No representation is being made that any account will or is likely to achieve profits or losses similar to those shown. Past or simulated results are not indicative of future results.