Introduction
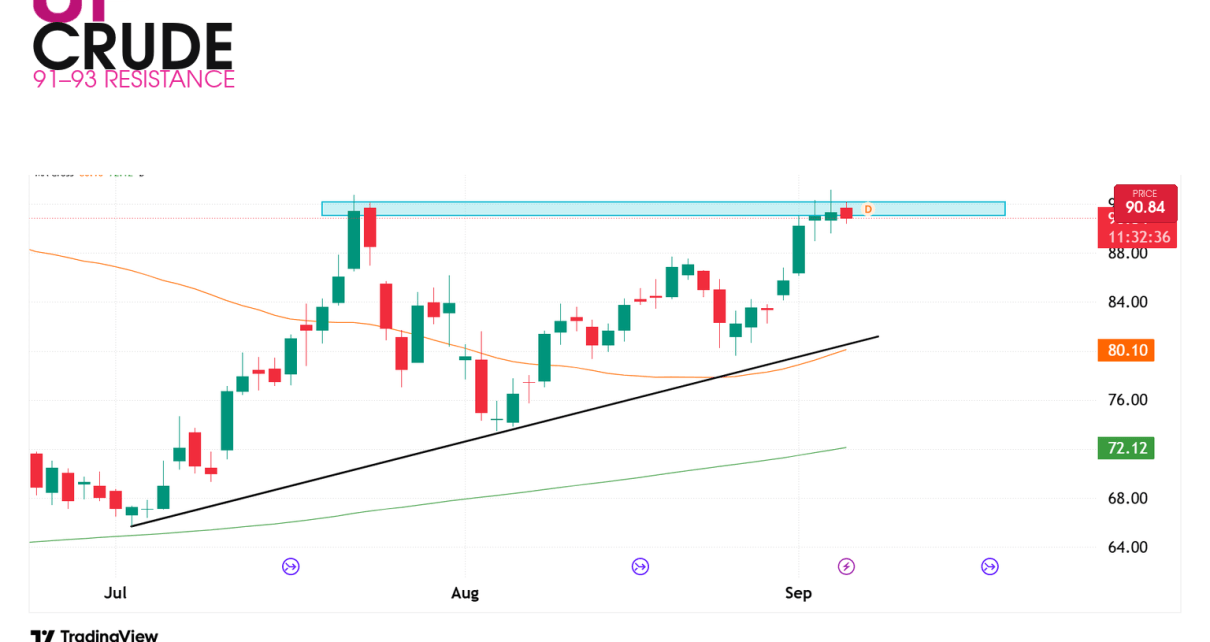
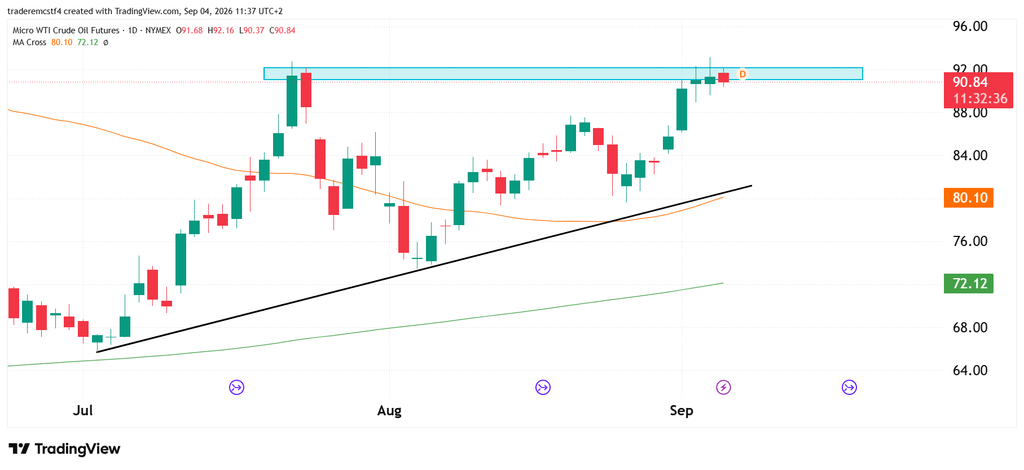
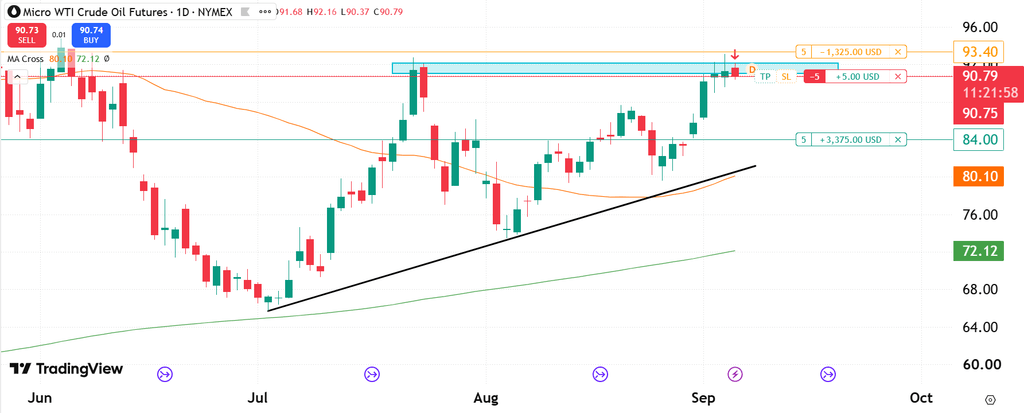
Crude oil futures are testing a resistance band around 91 to 93. On the 4 September session price was 90.84 after tagging as high as 92.16 inside that zone. The Primary setup from here is a short off that resistance, with a stop just above Thursday’s session high at 93.15 and a target around 84 to monitor over the next week. A daily close back above 93.15 cancels that short.
Today is US non-farm payrolls day, so this is a risky print to lean into. The setup still looked worth tracking on our OneUp Trader account.
Hormuz and NFP, in Context
- The Middle East and the Strait of Hormuz remain the main fundamental driver for crude. That picture matters more than any single candle on this chart.
- Price has climbed into the same 91–93 resistance area that capped the mid-July spike, and the 4 September session is already showing some rejection inside the band.
- Friday’s NFP, unemployment rate, and average hourly earnings can move the dollar and risk assets hard, and crude often gets pulled into the same volatility.
The bigger picture: technicals are useful at this resistance, but the fundamental story around Hormuz still leads. We’re watching that first.
Crude Oil Trend Analysis
The light-blue zone on the chart is the resistance zone we are watching. Crude has been pushing into it, and that is where the short case starts. Stop goes just above Thursday’s high at 93.15. If that holds and sellers keep control, the target we’re monitoring over the next week is around 84. If bulls reclaim and we get a daily close above 93.15, the shirt bias is finished.
Key Levels
| Level | Notes |
|---|---|
| 93.15 | Thursday’s session high. Stop sits just above; daily close above cancels the Primary short. |
| 91–93 | Resistance band. Price is testing this zone. |
| 92.16 | 4 September session high inside the band. |
| 90.84 | 4 September session price. |
| ~84 | Primary target to monitor over the next week. |
OneUp Trade Tracker
| Date | Symbol | Primary setup | Entry | Stop | Target | Result | R / points |
|---|---|---|---|---|---|---|---|
| 4 Sep 2026 | MCL | Short from 91–93 resistance | Resistance band ~91–93 | Just above 93.15 | ~84 (next week) | Open | — |
Educational and informational only. This is not financial advice and not a recommendation to buy or sell any futures contracts. Futures trading involves substantial risk of loss and may not be suitable for all investors. Always conduct your own research and consult with a licensed financial professional before making trading decisions. The Primary setup above is a TradingView simulation track, not a live account signal.
Hypothetical or simulated performance results have certain limitations. Unlike an actual performance record, simulated results do not represent actual trading. Also, since the trades have not been executed, the results may have under- or over-compensated for the impact, if any, of certain market factors, such as lack of liquidity. Simulated trading programs in general are also subject to the fact that they are designed with the benefit of hindsight. No representation is being made that any account will or is likely to achieve profits or losses similar to those shown. Past or simulated results are not indicative of future results.