Introduction
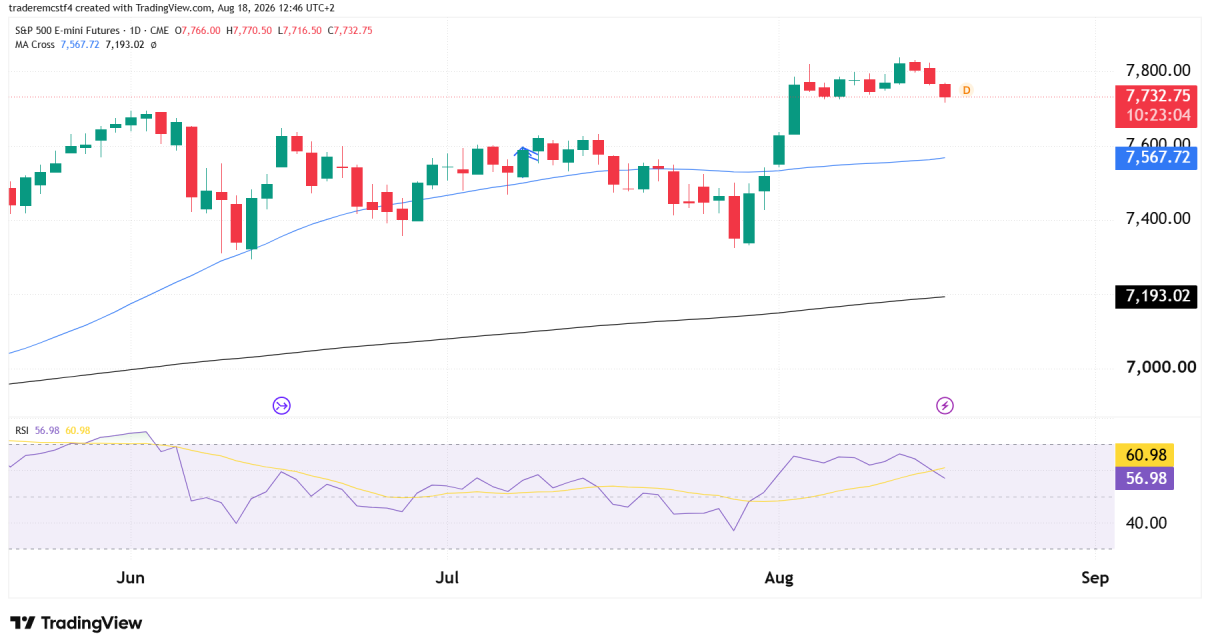
Of the three index’s we have covered this month, ES has been the least dramatic. Nasdaq spent a week coiled beneath 30,000 waiting on inflation data, and the Dow built a rising wedge with momentum quietly failing to confirm its highs. The S&P has done neither. It ran roughly 450 points off its early-August low, printed a record close at 7,798.99 on August 13, and has drifted modestly lower since.
That drift is now three sessions old. The current session opened at 7,766.00 and closed at 7,731.75, near its low, and RSI has crossed below its signal line for the first time since the August breakout.
The question is whether this is routine profit-taking inside a strong uptrend, or the beginning of something that pulls price back toward the 50 moving average sitting 165 points below.
Trend Analysis
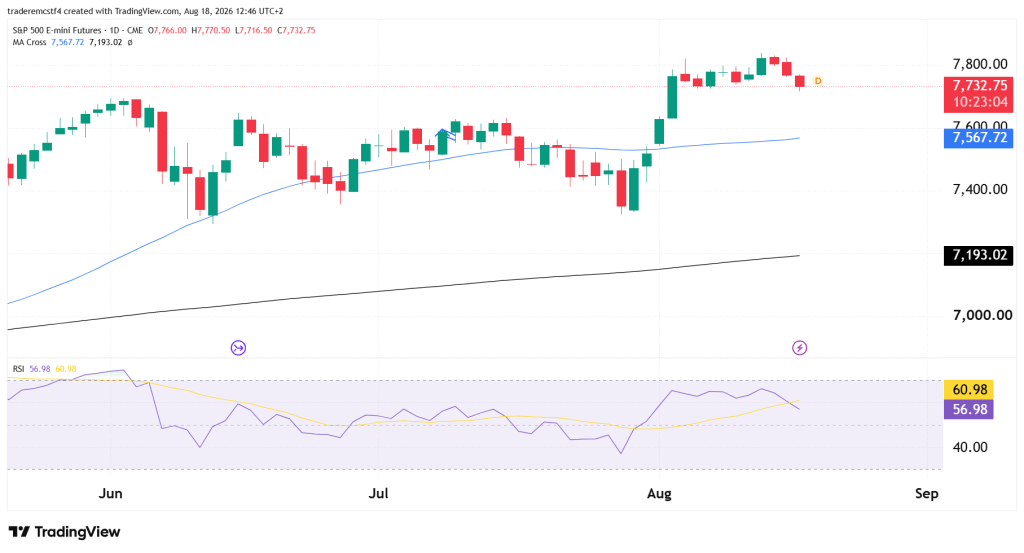
Structurally this is the cleanest of the three index charts. Price at 7,731.75 sits well above both moving averages — 7,567.70 and 7,193.02 — and both are rising. There is no wedge, no coil, and no divergence between price and momentum at the highs. What there is, is a shallow pullback: the retreat from the August high near 7,790 amounts to roughly 58 points, or 0.75%, which barely registers against the run that preceded it.
The Pullback, in Context
The move lower has identifiable causes rather than being a technical drift. A few points worth flagging:
- Records were set before the fade. The S&P 500 closed at a record 7,798.99 on August 13 before easing to 7,785.76 on Friday, still capping a third consecutive weekly gain, with 25 all-time highs logged in 2026 so far.
- Friday’s reversal had three drivers. Profit-taking after the record closes, rising Treasury yields, and a surprise drop in July retail sales — the largest monthly decline in more than a year, according to Census Bureau data.
- Earnings remain the support underneath. Second-quarter earnings are on pace for roughly 29% year-over-year growth, with analysts raising twelve-month EPS estimates at an unusually fast pace.
The bigger picture: the retail sales miss cuts both ways. A weaker consumer reduces the case for a September rate hike, which has been this rally’s main fuel, but it also raises questions about the growth backdrop that earnings have been resting on. FOMC minutes from the July 28-29 meeting — where three members dissented in favor of raising rates — publish Wednesday, with Walmart and Target reporting through the week and Nvidia on August 26.
Key Support and Resistance Levels
Major Resistance
| Level | Notes |
|---|---|
| 7,770.50 | Session high, capping the current pullback |
| 7,790 – 7,800 | August high and the round number just above it |
| 8,000 | Next round-number objective on a sustained breakout |
Major Support
| Level | Notes |
|---|---|
| 7,716.50 | Session low |
| 7,690 – 7,700 | Floor of the August consolidation range |
| 7,567.70 | Faster moving average, rising and 165 points below price |
Possible Trades
Bullish continuation
- Entry trigger: daily close above 7,770.50
- Stop: below 7,690
- Target: 7,790–7,800 initial, 8,000 extended
Deeper pullback
- Entry trigger: daily close below 7,690
- Stop: above 7,790
- Target: 7,567.70 initial, with little structural support between there and the July range
Invalidation / range scenario
- Continued chop between 7,690 and 7,790 should be read as consolidation after a 450-point run rather than distribution — three shallow red sessions off a record is not a reversal signal on its own
- The RSI crossover is a reason to watch the range floor more closely, not a reason to anticipate the break
- With FOMC minutes Wednesday and retail earnings across the week, event risk is concentrated rather than spread out
Summary
ES is 0.75% off a record close with both moving averages rising well beneath it, which makes this a pullback rather than a problem. The RSI crossover is the first real caution since the August breakout, but the 7,690–7,700 floor is what needs to break before the picture actually changes. With the FOMC minutes and a run of retail earnings ahead, the near-term direction is more likely to come from the calendar than from the chart.
Trading futures involves substantial risk of loss and is not suitable for all investors. Past performance is not indicative of future results. This analysis is for informational and educational purposes only and does not constitute financial advice. Always conduct your own due diligence and consult with a licensed financial advisor before making any trading decisions.