Introduction
NQ has gone through a full cycle this year — a spring correction, a powerful V-shaped recovery to new highs, and now a sharp pullback that’s erased a meaningful chunk of the summer rally. Rather than forcing a single high-conviction call, this is a good spot to lay out the weighted scenarios, since the technical picture supports more than one outcome from here.
Trend Analysis
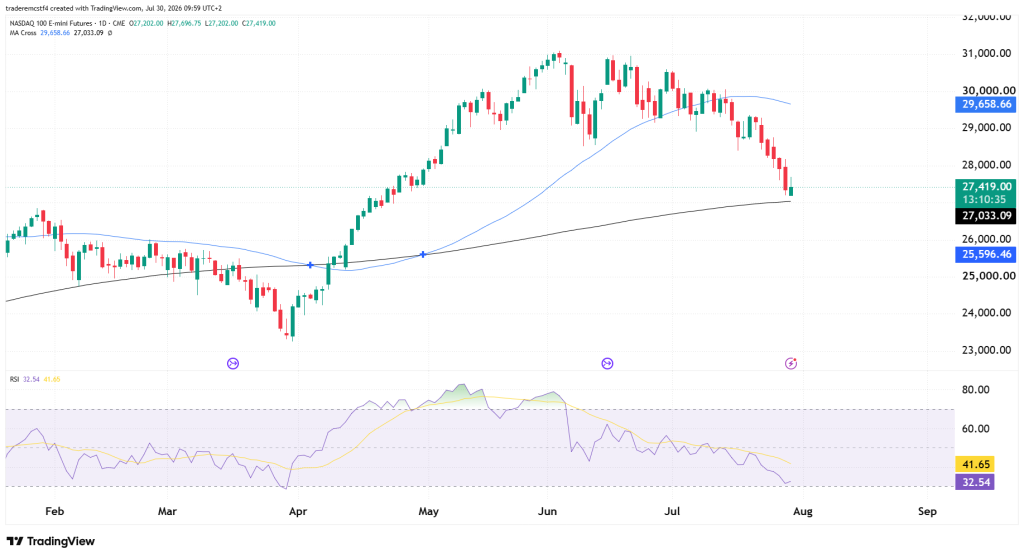
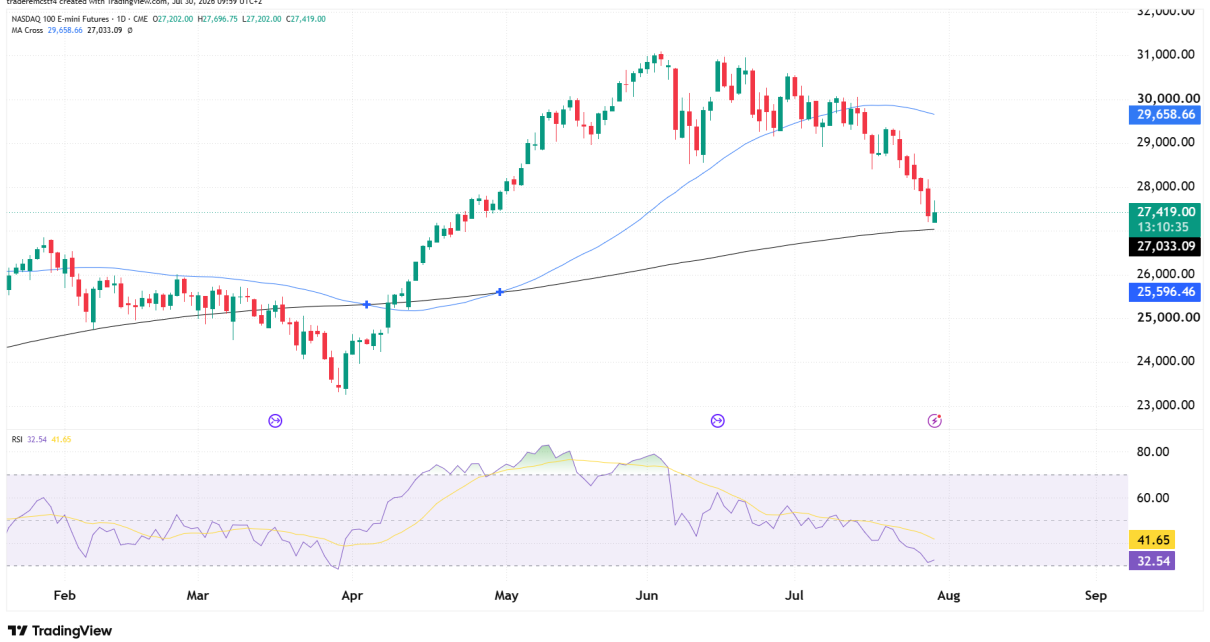
The year so far breaks into three phases:
- Range and correction (Jan – early Apr): Price chopped between roughly 25,000 and 26,500 through January and February before breaking down into a sharp correction that bottomed at 23,254 in early April.
- V-shaped recovery (Apr – early Jun): A powerful, near-uninterrupted rally carried price from that low to a high of 31,100 in early June — one of the cleaner trend moves on this chart all year.
- Distribution and breakdown (Jun – present): Price made a lower high in mid-July, then broke down sharply, falling to 27,443 in a matter of weeks.
The moving averages show a market in transition: the 50 MA (29,659.15) is broken to the downside, while the 200 MA (27,033.21) still rises — price sits between them, the typical pause point for deciding if a pullback is corrective or something bigger.
RSI backs this up. It diverged bearishly in May-June, peaking above 80 while price kept making new highs, an early warning before the breakdown. It’s now at 32.88, signal line 41.67, both rolling toward oversold — stretched selling pressure, not yet a green light to buy.
Key Support and Resistance Levels
Major Resistance
| Level | Notes |
|---|---|
| 29,659.15 | Faster moving average; broken to the downside, now the first hurdle for any recovery |
| 30,300 | Mid-July lower high, the most recent failed attempt to extend the rally |
| 31,100 | Early June swing high and the year’s high so far |
Major Support
| Level | Notes |
|---|---|
| 27,443 | Today’s close; also the horizontal level that served as the launch pad for May’s breakout — the level currently being tested |
| 27,033.21 | Slower moving average; the key line separating a healthy pullback from a more serious trend change |
| 26,000 – 25,600 | Prior consolidation zone from the spring recovery; next logical support if 27,033 fails |
| 23,600 | April correction low; a deep downside level, only relevant if the broader uptrend structure fails entirely |
Possible Trades
Bullish scenario — support holds
- Entry trigger: daily close back above 27,696.75 (today’s high), holding above 27,033.21
- Stop: below 27,033.21
- Target: 29,659.15 initial, 30,300 extended
Bearish scenario — support fails
- Entry trigger: daily close below 27,033.21, confirming a break of the slower moving average
- Stop: back above 27,443
- Target: 26,000 initial, 25,600 extended
Invalidation / range scenario
- Continued chop between roughly 27,000 and 27,700 without a decisive close either side should be read as the market still digesting the recent breakdown — the probabilities above hold until one of these levels gives way convincingly
- A false break of either level that reverses within a session or two shouldn’t be treated as confirmation
Trading futures involves substantial risk of loss and is not suitable for all investors. Past performance is not indicative of future results. This analysis is for informational and educational purposes only and does not constitute financial advice. Nothing in this article should be construed as a recommendation to buy or sell any security or financial instrument. Always conduct your own due diligence and consult with a licensed financial advisor before making any trading decisions.