Introduction
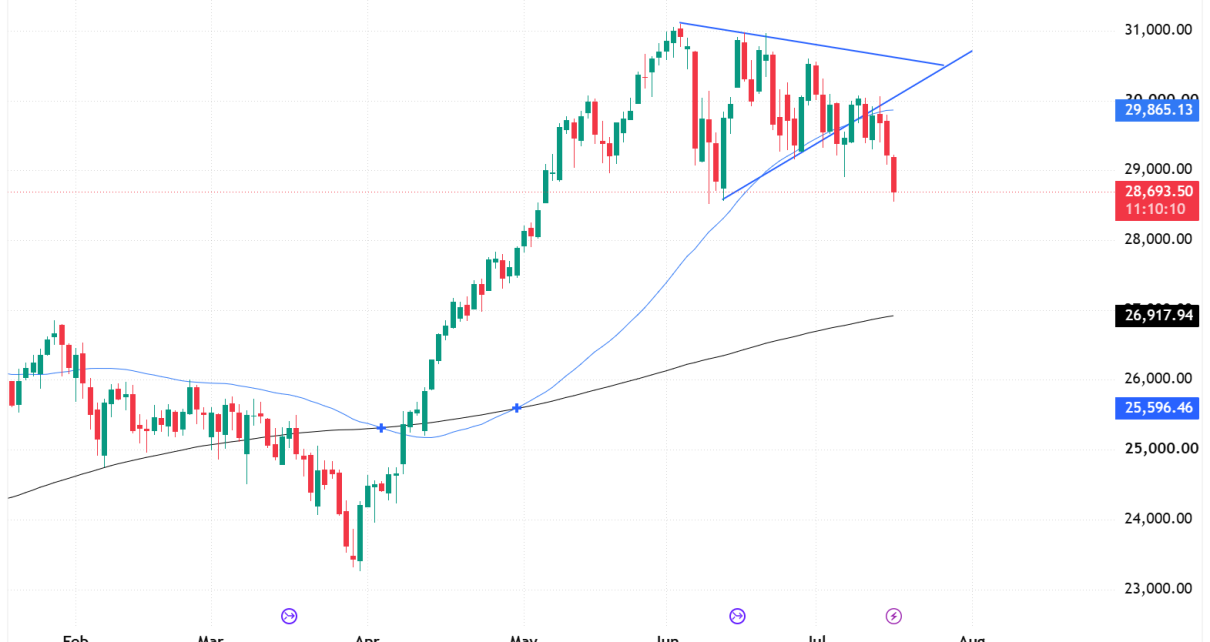
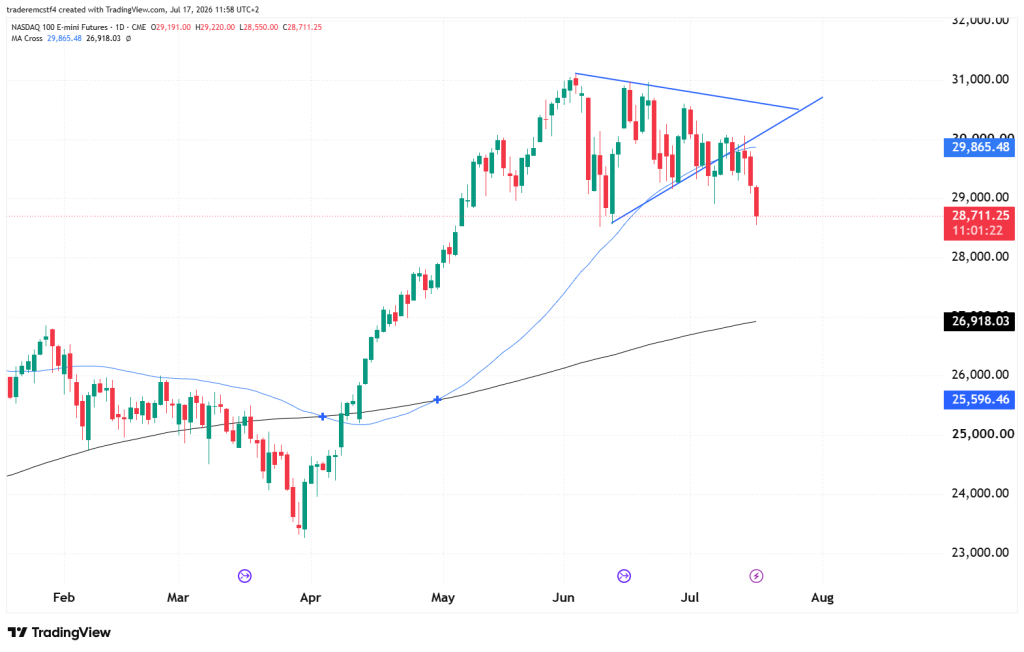
This is a follow-up to the 14 July analysis, where a close below 29,300 was flagged as the trigger for a deeper pullback, with 28,900 as the first target and the 200-day MA further below that. That scenario has now played out and gone further than the initial target — NQ closed at 28,707.50 on the 16th of July after trading as low as 28,550, confirming the breakdown.
What Played Out Since the Last Call
Nasdaq 100 Futures Trend Analysis
The short-term triangle that had been forming since mid-June is now decisively broken. Price is trading well below the rising trendline that previously offered support, and below the 50-day MA (29,865.41) by a wide margin. The 200-day MA (26,918.01) is still rising and hasn’t been tested, so the longer-term trend structure is intact, but the near-term picture has clearly shifted from consolidation to a genuine correction.
Worth noting: the height of the broken triangle (roughly 31,050 down to 28,550, about 2,500 points at its widest) projects a measured move down to around 26,800–26,900 if this breakdown continues — which lines up closely with the 200-day MA. That confluence makes 26,900 a more meaningful level to watch than it would otherwise be.
Key Levels
| Level | Notes |
|---|---|
| 29,865 | 50-day MA, now well above price and acting as resistance |
| 29,300 | Broken trendline / former support, now the level a bounce would need to reclaim to change the picture |
| 28,550 | Today’s low, immediate level on any continuation lower |
| 26,918 | 200-day MA, also lines up with the triangle’s measured-move target |
Possible Trades
Scenario 1: Continuation toward the 200-day MA (favored, given confirmed breakdown) With the breakdown confirmed by both the trendline break and today’s wide-range close, and a measured-move target that aligns with the 200-day MA, this is the higher-probability path in the near term.
- Entry: Bearish reaction on any bounce toward 29,300, or continuation shorts on a break of 28,550
- Stop: Above 29,300
- Target: 26,918, watching for a reaction there given the moving-average and measured-move confluence
Scenario 2: Oversold bounce back toward the broken trendline After a wide-range move like today’s, a short-term bounce back toward the former support (now resistance) around 29,300 is a reasonable near-term outcome, without necessarily changing the broader picture.
- Entry: Bullish reaction near 28,550, for a counter-trend bounce only
- Stop: Below 28,550
- Target: 29,300, where the level would need to be reclaimed and held to mean more than a bounce
Scenario 3: Quick reclaim of 29,300 Lowest-probability outcome given how decisively the breakdown confirmed today, but a fast move back above 29,300 would suggest today’s low was a flush rather than the start of a sustained correction.
This analysis is provided for educational and informational purposes only and should not be considered financial or trading advice. Trading futures, forex, and other leveraged financial instruments carries a high level of risk and may not be suitable for all investors. Past performance is not indicative of future results. Before making any trading decisions, conduct your own research, assess your risk tolerance, and consult with a qualified financial advisor if necessary.