

Introduction
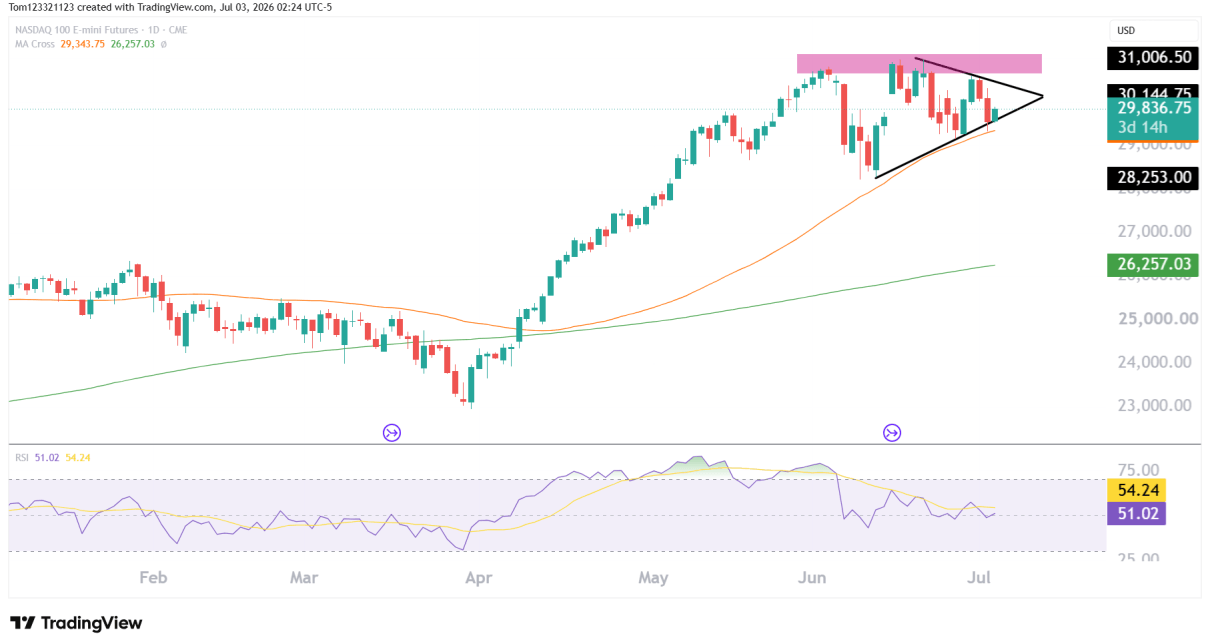
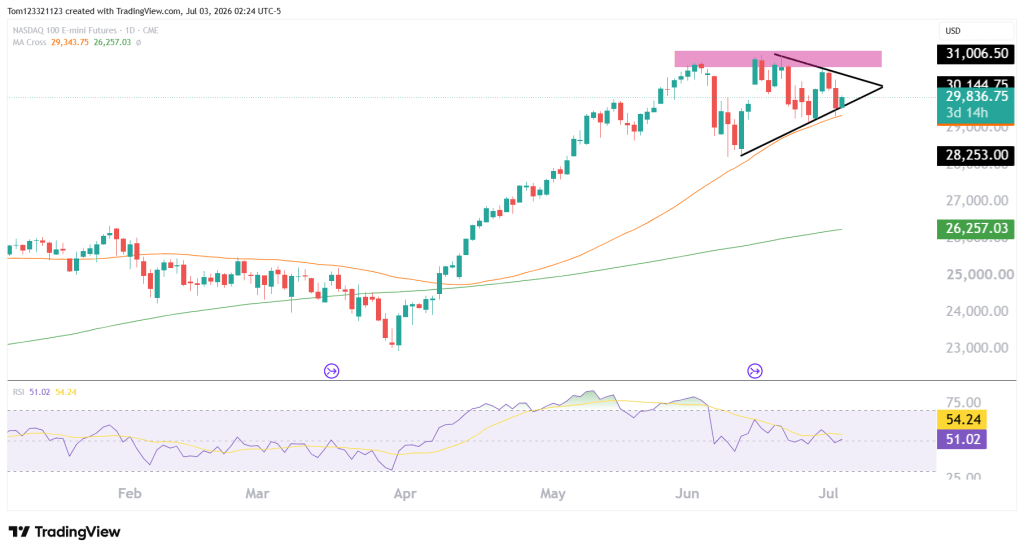
Nasdaq futures are consolidating after the explosive rally from the April lows. Since our previous analysis, buyers have successfully defended the 50-day moving average, but they have also struggled to produce a decisive breakout above the 30,800–31,000 resistance zone.
Instead of seeing either buyers or sellers take control, NQ has moved into a triangle pattern. This is not a strange development in price action after the big rally we saw in NQ, now the market is digesting the gains, some profit taking is happening but buying power is still strong enough to hold the price up.
In todays technical analysis we will look at possible long trades bulls could take and other technicals to back up the trade.
NQ Futures Trend Analysis
Important Levels
Current technicals show:
- Current price trading around 29,840 (at time of writing the article)
- Major resistance between 30,800 and 31,000
- Triangle support around 29,300
- 50-day moving average near 29,340
- 200-day moving average near 26,257
The trend remains bullish, with price holding above the rising 50-day and 200-day moving averages. However, momentum has slowed in recent weeks as the market consolidates within a symmetrical triangle.
Resistance around 30,800–31,000 continues to cap price, while buyers are stepping in at progressively higher levels. As the pattern narrows, the likelihood of a breakout increases and at this moment looks liek a higher chance to the upside.
The RSI has cooled from overbought levels and is now near 50. That 50 level is holding as support, so as long as it remains above it, bulls have another signal that favors them.
Estimated Probabilities for NQ Futures
| Scenario | Estimated Probability | Market Interpretation |
|---|---|---|
| Bullish breakout above 31,000 | 45% | Buyers resume the primary uptrend toward fresh highs |
| Continued triangle consolidation | 35% | Price continues compressing before a larger breakout develops |
| Breakdown below 29,300 support | 20% | Sellers trigger a deeper pullback toward the 200-day trend |
Key Support and Resistance Levels
Major Resistance Levels
- 30,800–31,000
- 31,500
- 32,000
Major Support Levels
- 29,300 triangle support
- 29,340 (50-day moving average)
- 28,250 previous swing low
- 26,257 (200-day moving average)
NQ Futures Possible Trades
Bullish Breakout Trade
The primary trend remains higher. A strong daily close above the 30,800–31,000 resistance zone would complete the current triangle and could signal the beginning of another leg higher as buyers regain momentum.
Consolidation Trade Setup
At the moment, consolidation remains a perfectly healthy outcome. Following the aggressive rally from April through early June, sideways price action allows momentum indicators to reset while buyers continue defending higher lows. As long as the 50-day moving average remains intact, the broader bullish structure remains unchanged.
Bearish Breakdown Trade
While less likely, traders should continue monitoring the rising trendline around 29,300. A decisive break below both triangle support and the 50-day moving average would increase the probability of a larger correction toward the 28,250 area before buyers potentially step back in.
This analysis is provided for educational and informational purposes only and should not be considered financial or trading advice. Trading futures, forex, and other leveraged financial instruments carries a high level of risk and may not be suitable for all investors. Past performance is not indicative of future results. Before making any trading decisions, conduct your own research, assess your risk tolerance, and consult with a qualified financial advisor if necessary.
