

Introduction
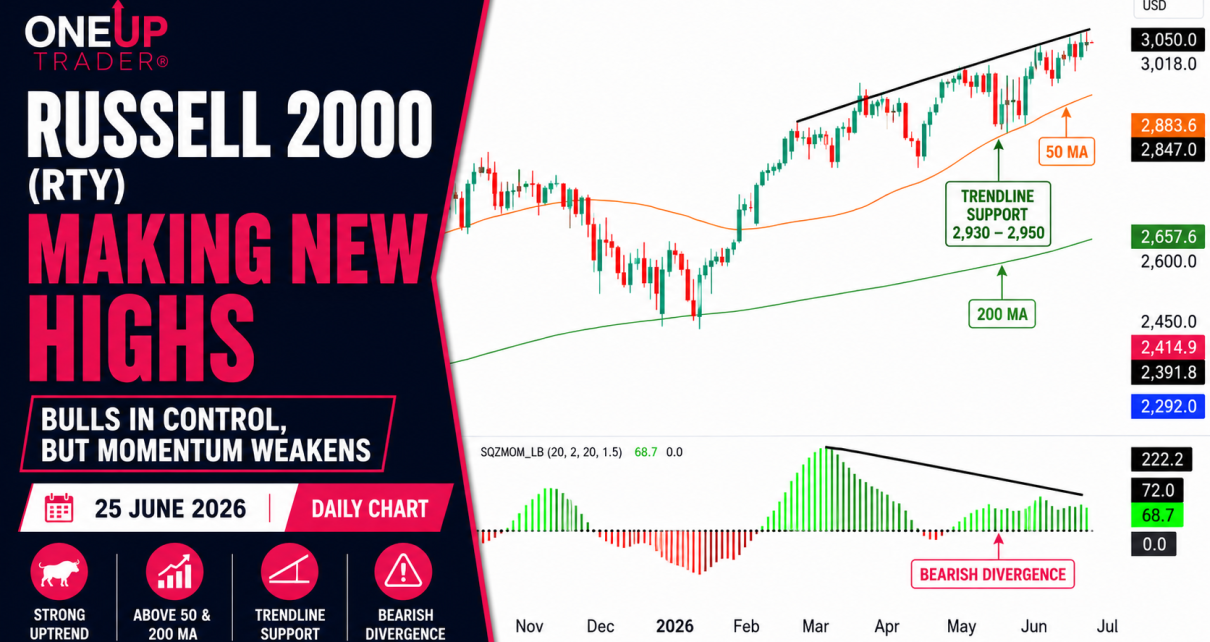
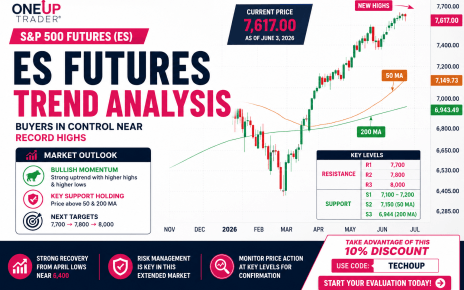
Russell 2000 futures continue to quietly outperform after the sharp recovery from the April lows. While the S&P 500 and Nasdaq have received most of the attention, small caps have steadily climbed higher, pushing into fresh yearly highs.
The price remains firmly bullish, though it might not be as strong as the rally we have seen in the NASDAQ or S&P 500. Long trades have been successful.
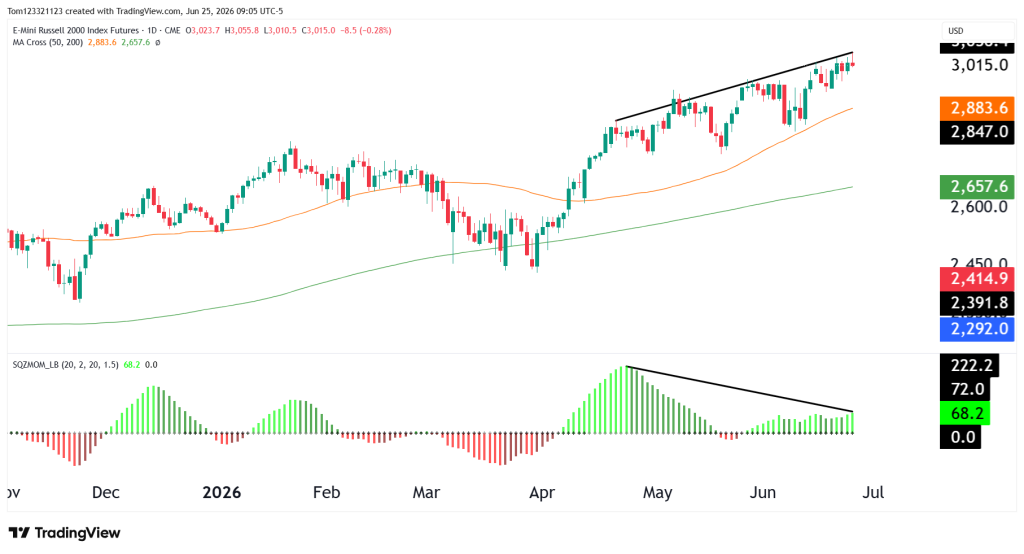
However, traders need to keep an eye on the Momentum indicator, which is showing bearish divergence. Looking at the price action and the strength of the move, it does not immediately mean we should see a pullback now, or even a consolidation period. There is a likely chance, however, that we see the price move sideways to digest the move before building up enough power to rally once more.
Let’s take a closer look at the chart.
RTY Futures Trend Analysis
Bears will be hoping that the divergence plays out and we see a drop in the price, so we can expect some short selling to accumulate at this area. Bulls will continue to buy up any pullbacks. The price right now looks slightly overextended in the short term, and we may see a few red sessions or a small pullback to the 50 MA before we get the next concrete move.
Estimated Probabilities for RTY Futures
| Scenario | Estimated Probability | Market Interpretation |
|---|---|---|
| Consolidation above 50 MA before another push higher | 60% | |
| Continued rally toward 3,100 | 40% | Possible in the future but more likely we see a pullback before |
Key Support and Resistance Levels
Major Resistance Levels
- 3,050 recent high
- 3,100 psychological resistance
- 3,200
Major Support Levels
- 2,950 rising trendline
- 2,884 (50-day moving average)
- 2,658 (200-day moving average)
RTY Possible Trades
Bullish Continuation Trade
The primary trend remains higher. If buyers continue defending the 50 MA and push above the recent highs, RTY could continue extending its rally toward the 3,100 region.
Consolidation Trade Setup
The bearish divergence suggests momentum is cooling after a strong advance. Rather than expecting an immediate reversal, traders may see the market move sideways while allowing moving averages and momentum indicators to reset before the next directional move.
Bearish Pullback Trade
Although the longer-term structure remains bullish, traders should continue monitoring the divergence closely. If price begins breaking below the rising trendline and loses the 50-day moving average, the probability of a larger corrective move would increase considerably.
This analysis is provided for educational and informational purposes only and should not be considered financial or trading advice. Trading futures, forex, and other leveraged financial instruments carries a high level of risk and may not be suitable for all investors. Past performance is not indicative of future results. Before making any trading decisions, conduct your own research, assess your risk tolerance, and consult with a qualified financial advisor if necessary.
