

Introduction
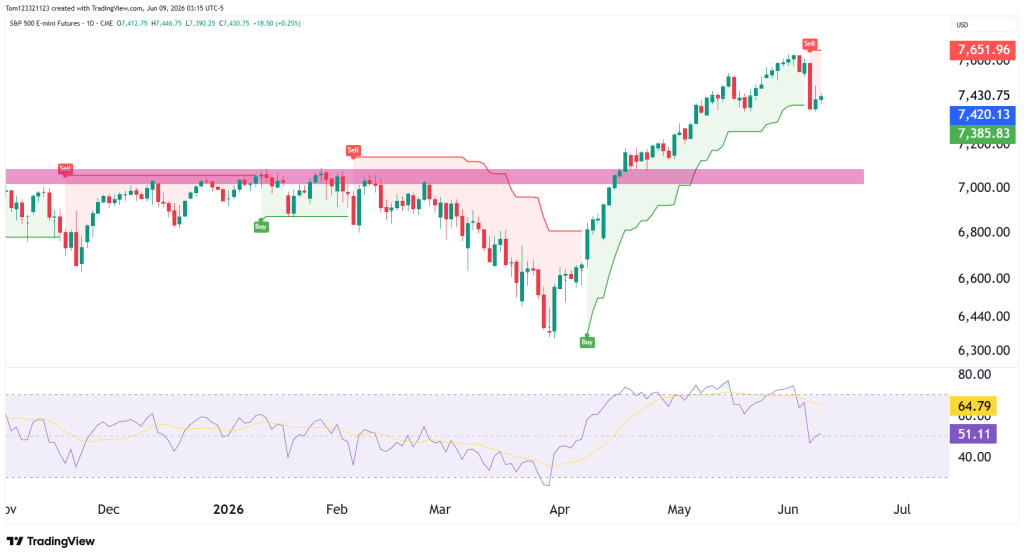
S&P 500 futures have finally seen the pullback that we began discussing in our recent analysis. In both our May 26 and June 3 reports, we highlighted that while the longer-term trend remained bullish, momentum indicators were beginning to cool as prices continued making new highs.
ES overall is still in a strong bullish trend, but it was getting overheated, and the pullback now seems to be normal profit-taking. Something the bears could be monitoring is the sell signal on the supertrend, which is the first one since February. That sell signal led ES to drop 9%. The question now is whether this signal will lead to a sizeable drop to take advantage of or if we see a consolidation period moving forward.
ES Futures Trend Analysis
Important Points
Traders need to keep an eye on the support level above $7,000. If we see a pullback then that would be the first level of support we could see some buying step in. Looking at the chart right now, it is likely that we see a consolidation for a week or so as the market digests the previous rally.
It might be the time now for bulls to wait for another entry and for more clarity going forward. With that said, short selling now would also be a risk because there is no big signal to show the market is heading downward.
Estimated Probabilities for ES Futures
| Scenario | Estimated Probability | Market Interpretation |
|---|---|---|
| Recovery toward 7,650 highs | 50% | Buyers regain momentum and resume the uptrend |
| Consolidation between 7,350 and 7,650 | 35% | Market digests recent gains and resets momentum |
| Deeper pullback toward 7,100 support | 15% | Sellers gain temporary control and extend the correction |
Key Support and Resistance Levels
Major Resistance Levels
- 7,650 recent high
- 7,700
- 7,800
Major Support Levels
- 7,385 trend support
- 7,200
- 7,000–7,100 breakout zone
ES Possible Trades
Bullish Continuation Trade
The primary trend remains higher. If buyers continue defending support and push price back toward the recent highs, ES could resume its move higher and challenge the 7,650 region once again.
Consolidation Trade Setup
Following the aggressive rally from April through early June, a period of sideways consolidation would not be surprising. Markets often pause after strong advances, allowing momentum indicators to reset before the next directional move develops.
Bearish Rejection Trade
While the broader trend remains bullish, traders should continue monitoring support levels closely. A break below the current trend structure would increase the probability of a deeper retracement toward the previous breakout zone near 7,100.
This analysis is provided for educational and informational purposes only and should not be considered financial or trading advice. Trading futures, forex, and other leveraged financial instruments carries a high level of risk and may not be suitable for all investors. Past performance is not indicative of future results. Before making any trading decisions, conduct your own research, assess your risk tolerance, and consult with a qualified financial advisor if necessary.
