

Introduction
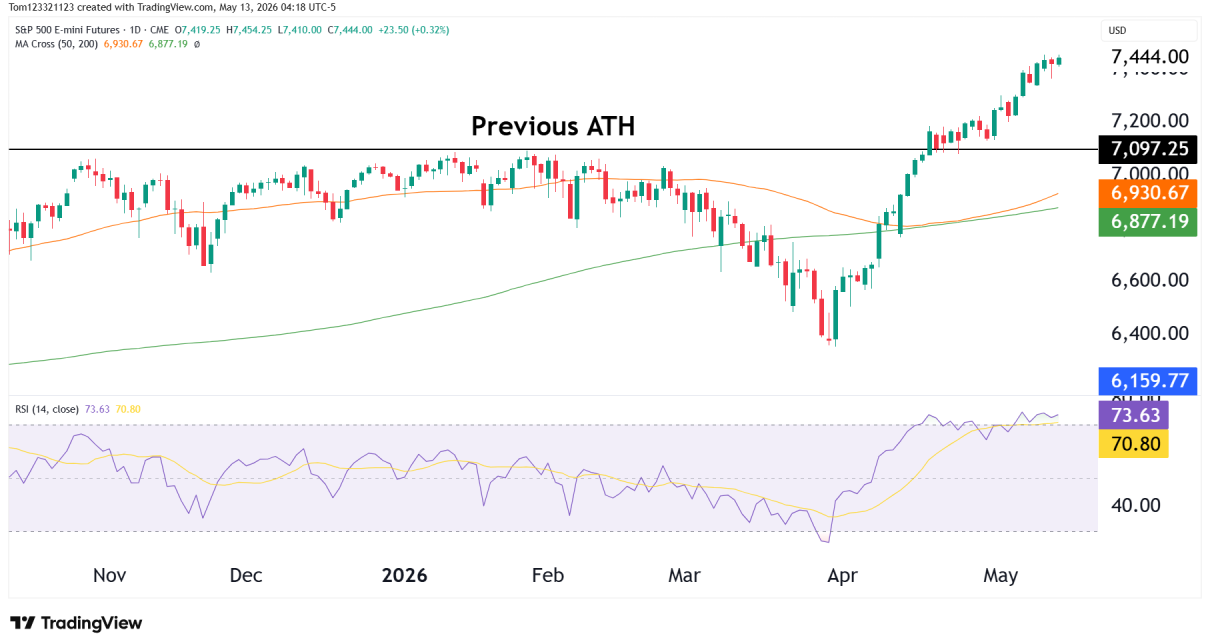
The S&P 500 continues to push higher after reclaiming the previous all-time high near 7,100, and the strength of this rally is becoming difficult to ignore. The narrative of being careful because of the developments in the Middle East is starting to fade because the market is just moving up relentlessly.
What started as a sharp V-shaped recovery from the March lows has now evolved into a sustained breakout, with buyers continuing to step in on even shallow pullbacks.
At this stage, the market is clearly being driven by momentum, improving sentiment, and confidence that the Federal Reserve is nearing the end of its restrictive cycle.
ES Daily Chart Technical Analysis
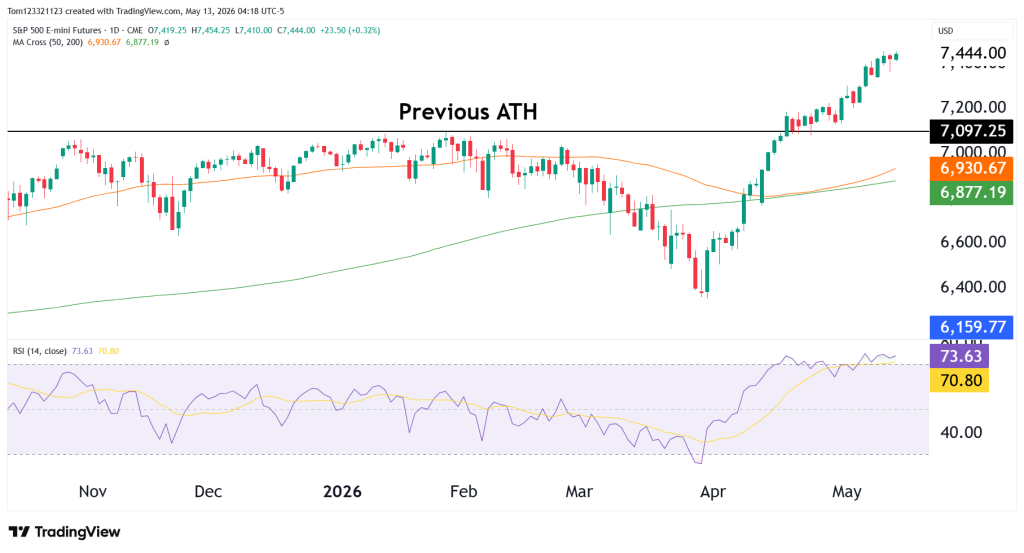
The interesting aspect here is how little resistance the market has shown during the move higher. Pullbacks have remained shallow, and candles continue closing near highs. It is difficult for bears to find shorts at the moment.
RSI is now pushing above 73 and has been overbought since the middle of April. This is showing the strength of the trend and doesn’t mean that a sell-off is coming. The RSI can remain overbought for a long time before the market retraces, and in this case, it is showing the momentum.
Right now, the trend remains bullish, but the market is becoming increasingly extended in the short term.
Key Levels
- Previous ATH / major support: 7,097
- Near-term support: 7,250–7,300
- 50-day moving average: ~6,930
- Major support: 6,850–6,900
As long as ES remains above the previous ATH, buyers remain in control. According to this analysis, shorts are better avoided until a clear change in trend occurs.
Market Drivers and Upcoming Events
Inflation data remains one of the biggest catalysts for equities right now. Traders continue focusing heavily on CPI and PPI releases because they directly influence expectations around future Federal Reserve policy.
The market is also paying close attention to Fed commentary after the recent “wait and see” messaging from policymakers. Any signs that rate cuts could arrive sooner than expected would continue supporting equities.
Scenarios and Probabilities
| Scenario | Description | Estimated Probability |
|---|---|---|
| Continued Rally | Momentum continues toward 7,500+ | 45% |
| Consolidation | Sideways movement above previous ATH | 40% |
| Pullback | Rejection leads to retracement toward 7,100 | 15% |
Possible Trades
Long setups still favor pullbacks into support, even though they are very shallow, rather than chasing extended candles after multiple strong sessions higher.
Short setups become more attractive only if the market begins losing momentum while breaking back below the 7,100 breakout area.
This analysis is provided for educational and informational purposes only and should not be considered financial or trading advice. Trading futures, forex, and other leveraged financial instruments carries a high level of risk and may not be suitable for all investors. Past performance is not indicative of future results. Before making any trading decisions, conduct your own research, assess your risk tolerance, and consult with a qualified financial advisor if necessary.
